Thai vs Tsimshian GED/Equivalency
COMPARE
Thai
Tsimshian
GED/Equivalency
GED/Equivalency Comparison
Thais
Tsimshian
89.1%
GED/EQUIVALENCY
100.0/ 100
METRIC RATING
6th/ 347
METRIC RANK
86.6%
GED/EQUIVALENCY
88.3/ 100
METRIC RATING
133rd/ 347
METRIC RANK
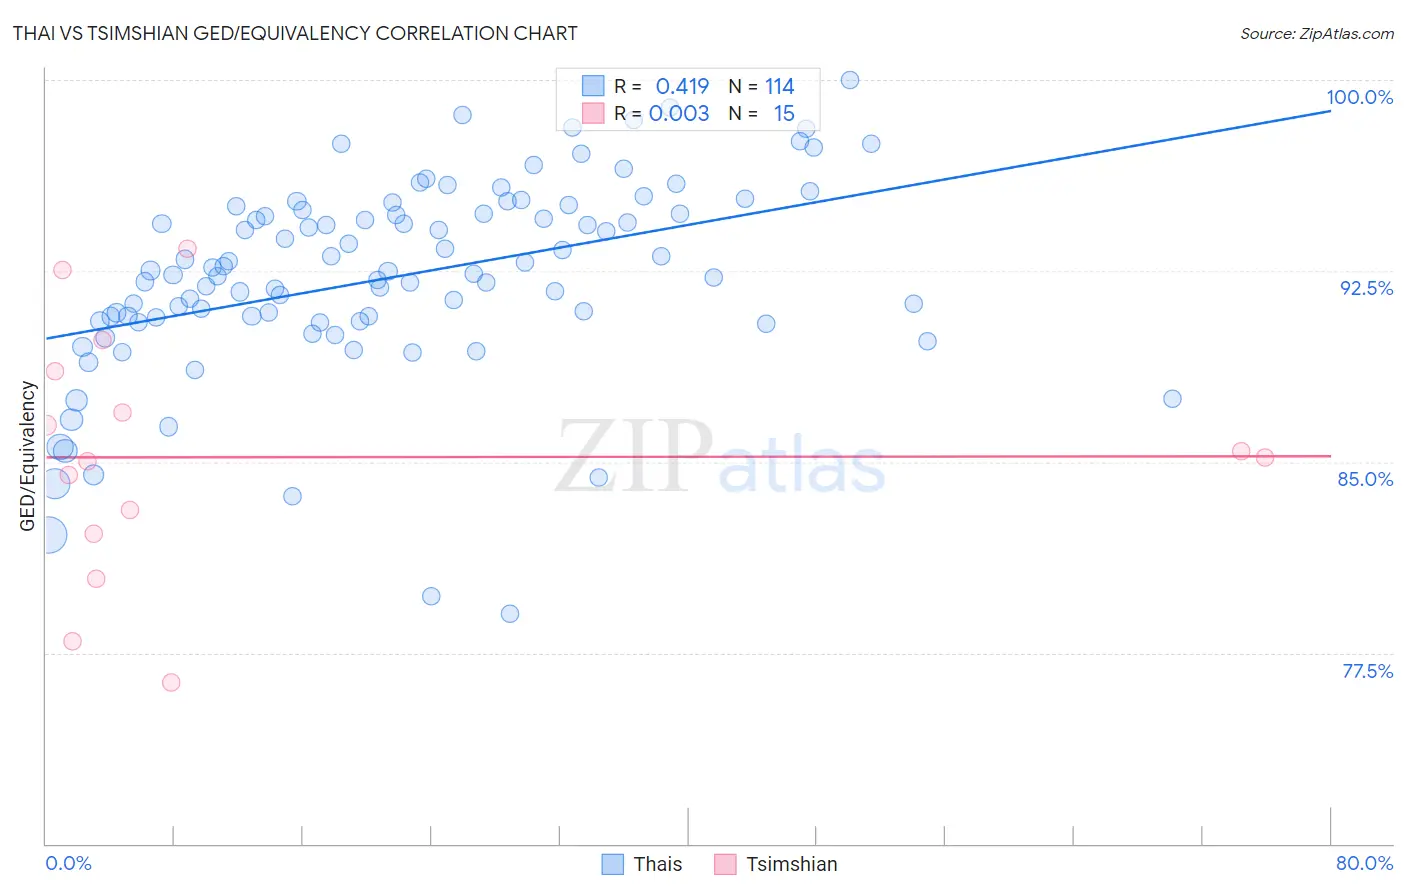
Thai vs Tsimshian GED/Equivalency Correlation Chart
The statistical analysis conducted on geographies consisting of 475,814,962 people shows a moderate positive correlation between the proportion of Thais and percentage of population with at least ged/equivalency education in the United States with a correlation coefficient (R) of 0.419 and weighted average of 89.1%. Similarly, the statistical analysis conducted on geographies consisting of 15,626,544 people shows no correlation between the proportion of Tsimshian and percentage of population with at least ged/equivalency education in the United States with a correlation coefficient (R) of 0.003 and weighted average of 86.6%, a difference of 2.9%.
GED/Equivalency Correlation Summary
| Measurement | Thai | Tsimshian |
| Minimum | 79.0% | 76.3% |
| Maximum | 100.0% | 93.4% |
| Range | 21.0% | 17.1% |
| Mean | 92.3% | 85.2% |
| Median | 92.4% | 85.2% |
| Interquartile 25% (IQ1) | 90.5% | 82.2% |
| Interquartile 75% (IQ3) | 94.7% | 88.6% |
| Interquartile Range (IQR) | 4.2% | 6.4% |
| Standard Deviation (Sample) | 3.9% | 4.8% |
| Standard Deviation (Population) | 3.9% | 4.7% |
Similar Demographics by GED/Equivalency
Demographics Similar to Thais by GED/Equivalency
In terms of ged/equivalency, the demographic groups most similar to Thais are Latvian (89.2%, a difference of 0.020%), Eastern European (89.1%, a difference of 0.040%), Carpatho Rusyn (89.1%, a difference of 0.090%), Iranian (89.2%, a difference of 0.12%), and Chinese (89.0%, a difference of 0.12%).
| Demographics | Rating | Rank | GED/Equivalency |
| Immigrants | India | 100.0 /100 | #1 | Exceptional 89.7% |
| Filipinos | 100.0 /100 | #2 | Exceptional 89.5% |
| Immigrants | Singapore | 100.0 /100 | #3 | Exceptional 89.3% |
| Iranians | 100.0 /100 | #4 | Exceptional 89.2% |
| Latvians | 100.0 /100 | #5 | Exceptional 89.2% |
| Thais | 100.0 /100 | #6 | Exceptional 89.1% |
| Eastern Europeans | 99.9 /100 | #7 | Exceptional 89.1% |
| Carpatho Rusyns | 99.9 /100 | #8 | Exceptional 89.1% |
| Chinese | 99.9 /100 | #9 | Exceptional 89.0% |
| Norwegians | 99.9 /100 | #10 | Exceptional 89.0% |
| Bulgarians | 99.9 /100 | #11 | Exceptional 89.0% |
| Lithuanians | 99.9 /100 | #12 | Exceptional 88.9% |
| Immigrants | Iran | 99.9 /100 | #13 | Exceptional 88.9% |
| Cypriots | 99.9 /100 | #14 | Exceptional 88.9% |
| Okinawans | 99.9 /100 | #15 | Exceptional 88.9% |
Demographics Similar to Tsimshian by GED/Equivalency
In terms of ged/equivalency, the demographic groups most similar to Tsimshian are Immigrants from Brazil (86.6%, a difference of 0.0%), Immigrants from Spain (86.7%, a difference of 0.010%), Immigrants from Ukraine (86.7%, a difference of 0.030%), Immigrants from Germany (86.7%, a difference of 0.030%), and Albanian (86.6%, a difference of 0.030%).
| Demographics | Rating | Rank | GED/Equivalency |
| Asians | 90.3 /100 | #126 | Exceptional 86.7% |
| Argentineans | 89.7 /100 | #127 | Excellent 86.7% |
| Yugoslavians | 89.5 /100 | #128 | Excellent 86.7% |
| Immigrants | Ukraine | 88.9 /100 | #129 | Excellent 86.7% |
| Immigrants | Germany | 88.8 /100 | #130 | Excellent 86.7% |
| Immigrants | Spain | 88.5 /100 | #131 | Excellent 86.7% |
| Immigrants | Brazil | 88.4 /100 | #132 | Excellent 86.6% |
| Tsimshian | 88.3 /100 | #133 | Excellent 86.6% |
| Albanians | 87.7 /100 | #134 | Excellent 86.6% |
| Immigrants | Asia | 87.4 /100 | #135 | Excellent 86.6% |
| Chileans | 86.9 /100 | #136 | Excellent 86.6% |
| Arabs | 86.7 /100 | #137 | Excellent 86.6% |
| Immigrants | Argentina | 86.5 /100 | #138 | Excellent 86.6% |
| Immigrants | Malaysia | 85.0 /100 | #139 | Excellent 86.5% |
| Paraguayans | 84.1 /100 | #140 | Excellent 86.5% |