Lebanese vs Tsimshian GED/Equivalency
COMPARE
Lebanese
Tsimshian
GED/Equivalency
GED/Equivalency Comparison
Lebanese
Tsimshian
87.2%
GED/EQUIVALENCY
96.2/ 100
METRIC RATING
102nd/ 347
METRIC RANK
86.6%
GED/EQUIVALENCY
88.3/ 100
METRIC RATING
133rd/ 347
METRIC RANK
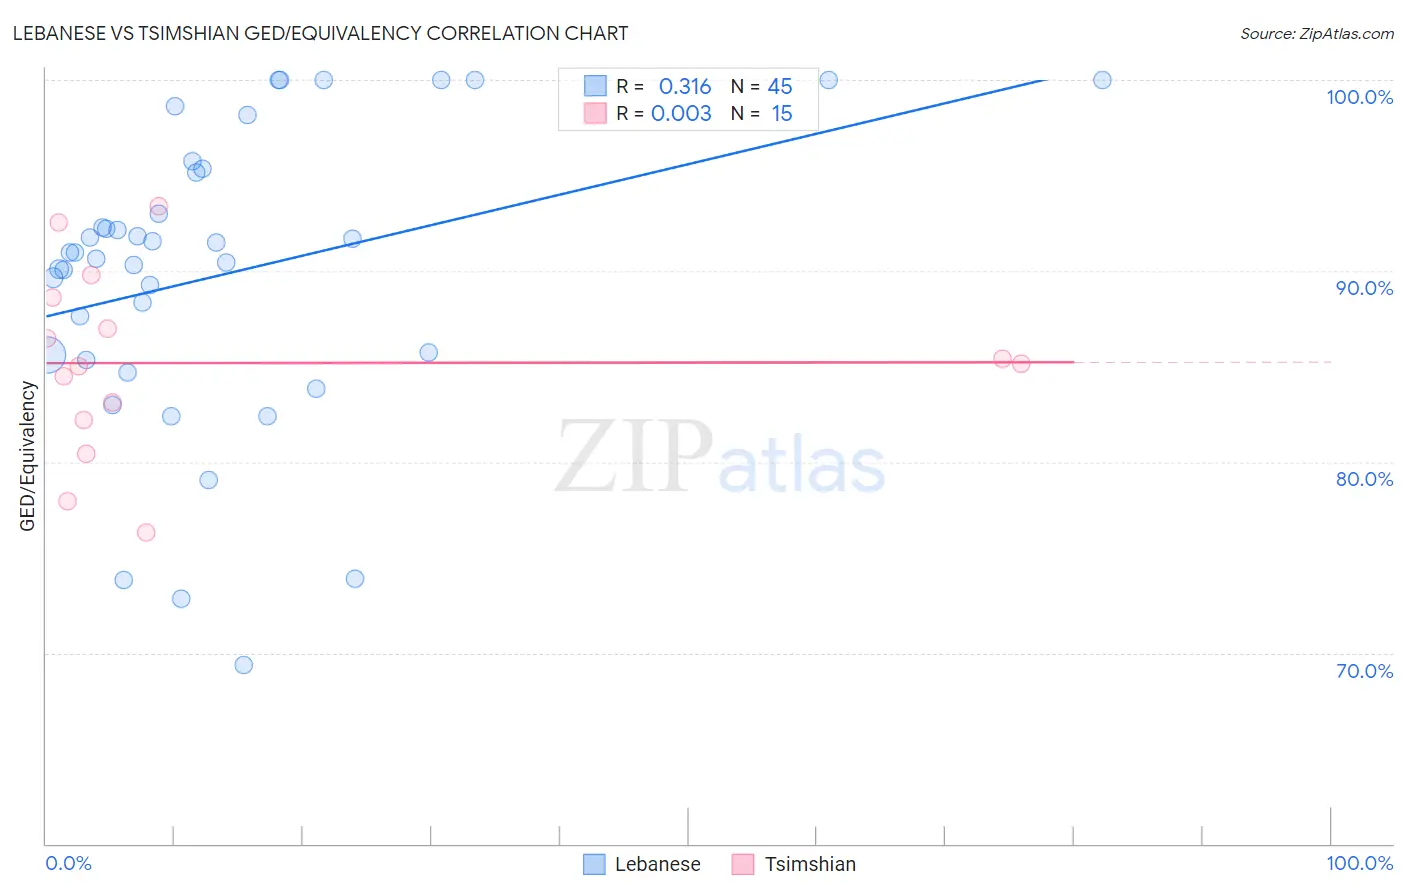
Lebanese vs Tsimshian GED/Equivalency Correlation Chart
The statistical analysis conducted on geographies consisting of 401,624,313 people shows a mild positive correlation between the proportion of Lebanese and percentage of population with at least ged/equivalency education in the United States with a correlation coefficient (R) of 0.316 and weighted average of 87.2%. Similarly, the statistical analysis conducted on geographies consisting of 15,626,544 people shows no correlation between the proportion of Tsimshian and percentage of population with at least ged/equivalency education in the United States with a correlation coefficient (R) of 0.003 and weighted average of 86.6%, a difference of 0.61%.
GED/Equivalency Correlation Summary
| Measurement | Lebanese | Tsimshian |
| Minimum | 69.4% | 76.3% |
| Maximum | 100.0% | 93.4% |
| Range | 30.6% | 17.1% |
| Mean | 89.8% | 85.2% |
| Median | 90.9% | 85.2% |
| Interquartile 25% (IQ1) | 85.5% | 82.2% |
| Interquartile 75% (IQ3) | 95.2% | 88.6% |
| Interquartile Range (IQR) | 9.8% | 6.4% |
| Standard Deviation (Sample) | 7.7% | 4.8% |
| Standard Deviation (Population) | 7.6% | 4.7% |
Similar Demographics by GED/Equivalency
Demographics Similar to Lebanese by GED/Equivalency
In terms of ged/equivalency, the demographic groups most similar to Lebanese are Jordanian (87.2%, a difference of 0.010%), Immigrants from Hungary (87.2%, a difference of 0.020%), Indian (Asian) (87.1%, a difference of 0.030%), Immigrants from Zimbabwe (87.1%, a difference of 0.050%), and Syrian (87.2%, a difference of 0.060%).
| Demographics | Rating | Rank | GED/Equivalency |
| Immigrants | Greece | 97.7 /100 | #95 | Exceptional 87.4% |
| Czechoslovakians | 97.6 /100 | #96 | Exceptional 87.4% |
| Immigrants | Western Europe | 97.3 /100 | #97 | Exceptional 87.3% |
| Immigrants | Croatia | 96.9 /100 | #98 | Exceptional 87.3% |
| Immigrants | Belarus | 96.9 /100 | #99 | Exceptional 87.3% |
| Palestinians | 96.8 /100 | #100 | Exceptional 87.3% |
| Syrians | 96.6 /100 | #101 | Exceptional 87.2% |
| Lebanese | 96.2 /100 | #102 | Exceptional 87.2% |
| Jordanians | 96.1 /100 | #103 | Exceptional 87.2% |
| Immigrants | Hungary | 96.0 /100 | #104 | Exceptional 87.2% |
| Indians (Asian) | 95.9 /100 | #105 | Exceptional 87.1% |
| Immigrants | Zimbabwe | 95.8 /100 | #106 | Exceptional 87.1% |
| Icelanders | 95.7 /100 | #107 | Exceptional 87.1% |
| Canadians | 95.6 /100 | #108 | Exceptional 87.1% |
| Immigrants | Eastern Europe | 95.5 /100 | #109 | Exceptional 87.1% |
Demographics Similar to Tsimshian by GED/Equivalency
In terms of ged/equivalency, the demographic groups most similar to Tsimshian are Immigrants from Brazil (86.6%, a difference of 0.0%), Immigrants from Spain (86.7%, a difference of 0.010%), Immigrants from Ukraine (86.7%, a difference of 0.030%), Immigrants from Germany (86.7%, a difference of 0.030%), and Albanian (86.6%, a difference of 0.030%).
| Demographics | Rating | Rank | GED/Equivalency |
| Asians | 90.3 /100 | #126 | Exceptional 86.7% |
| Argentineans | 89.7 /100 | #127 | Excellent 86.7% |
| Yugoslavians | 89.5 /100 | #128 | Excellent 86.7% |
| Immigrants | Ukraine | 88.9 /100 | #129 | Excellent 86.7% |
| Immigrants | Germany | 88.8 /100 | #130 | Excellent 86.7% |
| Immigrants | Spain | 88.5 /100 | #131 | Excellent 86.7% |
| Immigrants | Brazil | 88.4 /100 | #132 | Excellent 86.6% |
| Tsimshian | 88.3 /100 | #133 | Excellent 86.6% |
| Albanians | 87.7 /100 | #134 | Excellent 86.6% |
| Immigrants | Asia | 87.4 /100 | #135 | Excellent 86.6% |
| Chileans | 86.9 /100 | #136 | Excellent 86.6% |
| Arabs | 86.7 /100 | #137 | Excellent 86.6% |
| Immigrants | Argentina | 86.5 /100 | #138 | Excellent 86.6% |
| Immigrants | Malaysia | 85.0 /100 | #139 | Excellent 86.5% |
| Paraguayans | 84.1 /100 | #140 | Excellent 86.5% |