Taiwanese vs Immigrants from Scotland 7th Grade
COMPARE
Taiwanese
Immigrants from Scotland
7th Grade
7th Grade Comparison
Taiwanese
Immigrants from Scotland
94.8%
7TH GRADE
0.0/ 100
METRIC RATING
289th/ 347
METRIC RANK
97.1%
7TH GRADE
99.9/ 100
METRIC RATING
50th/ 347
METRIC RANK
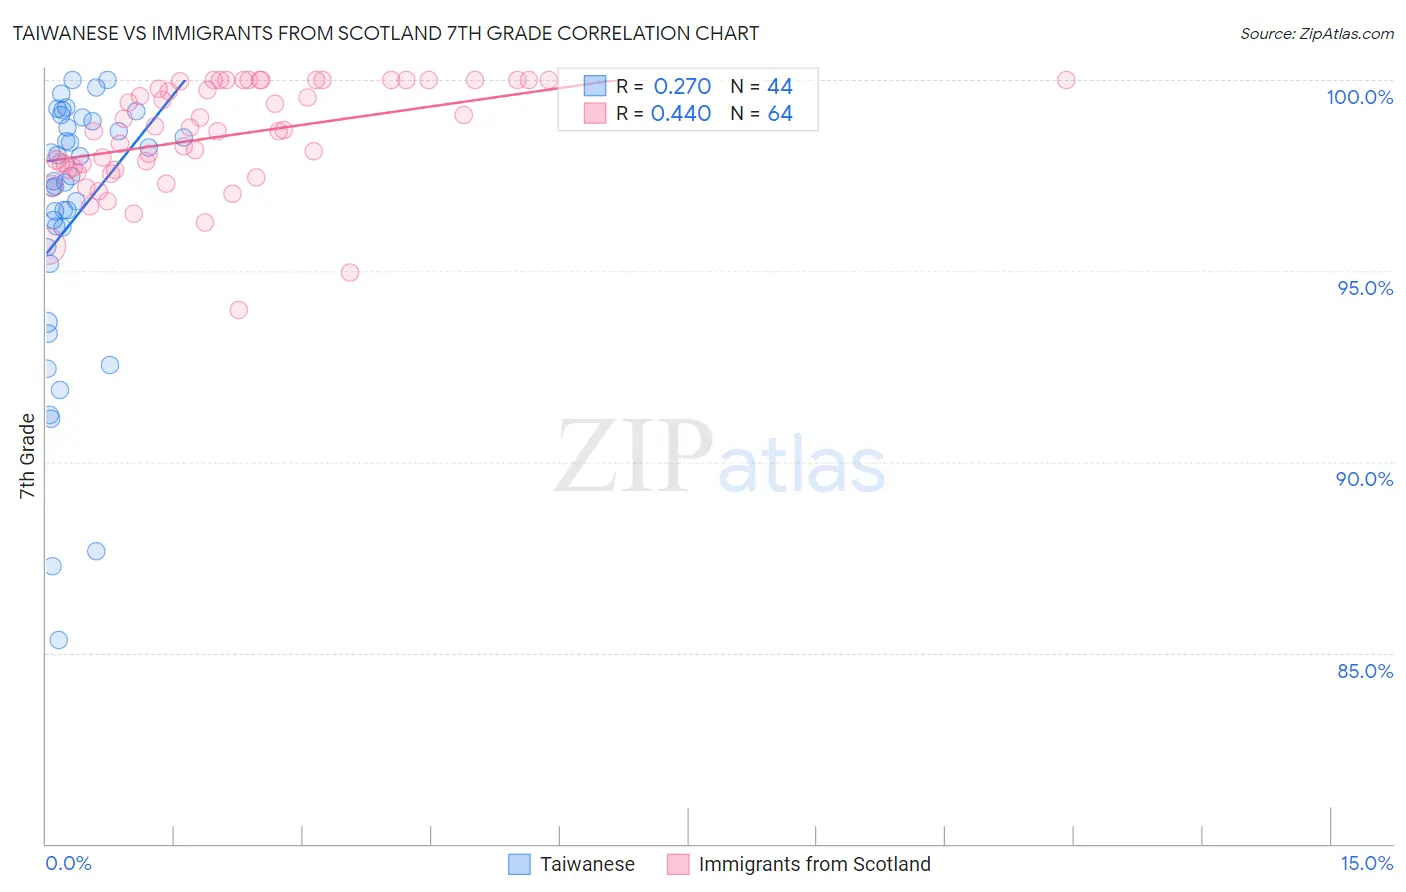
Taiwanese vs Immigrants from Scotland 7th Grade Correlation Chart
The statistical analysis conducted on geographies consisting of 31,724,936 people shows a weak positive correlation between the proportion of Taiwanese and percentage of population with at least 7th grade education in the United States with a correlation coefficient (R) of 0.270 and weighted average of 94.8%. Similarly, the statistical analysis conducted on geographies consisting of 196,398,887 people shows a moderate positive correlation between the proportion of Immigrants from Scotland and percentage of population with at least 7th grade education in the United States with a correlation coefficient (R) of 0.440 and weighted average of 97.1%, a difference of 2.3%.
7th Grade Correlation Summary
| Measurement | Taiwanese | Immigrants from Scotland |
| Minimum | 85.3% | 94.0% |
| Maximum | 100.0% | 100.0% |
| Range | 14.7% | 6.0% |
| Mean | 96.3% | 98.5% |
| Median | 97.3% | 98.7% |
| Interquartile 25% (IQ1) | 95.4% | 97.6% |
| Interquartile 75% (IQ3) | 98.8% | 100.0% |
| Interquartile Range (IQR) | 3.4% | 2.4% |
| Standard Deviation (Sample) | 3.6% | 1.4% |
| Standard Deviation (Population) | 3.5% | 1.4% |
Similar Demographics by 7th Grade
Demographics Similar to Taiwanese by 7th Grade
In terms of 7th grade, the demographic groups most similar to Taiwanese are British West Indian (94.8%, a difference of 0.010%), Malaysian (94.8%, a difference of 0.020%), Immigrants from Peru (94.9%, a difference of 0.030%), Immigrants from Philippines (94.9%, a difference of 0.040%), and Immigrants from Grenada (94.8%, a difference of 0.060%).
| Demographics | Rating | Rank | 7th Grade |
| Immigrants | Bolivia | 0.1 /100 | #282 | Tragic 95.0% |
| Immigrants | Barbados | 0.1 /100 | #283 | Tragic 95.0% |
| Armenians | 0.1 /100 | #284 | Tragic 95.0% |
| Immigrants | Eritrea | 0.1 /100 | #285 | Tragic 94.9% |
| Immigrants | Philippines | 0.0 /100 | #286 | Tragic 94.9% |
| Immigrants | Peru | 0.0 /100 | #287 | Tragic 94.9% |
| British West Indians | 0.0 /100 | #288 | Tragic 94.8% |
| Taiwanese | 0.0 /100 | #289 | Tragic 94.8% |
| Malaysians | 0.0 /100 | #290 | Tragic 94.8% |
| Immigrants | Grenada | 0.0 /100 | #291 | Tragic 94.8% |
| Immigrants | West Indies | 0.0 /100 | #292 | Tragic 94.8% |
| Fijians | 0.0 /100 | #293 | Tragic 94.7% |
| Haitians | 0.0 /100 | #294 | Tragic 94.7% |
| Yaqui | 0.0 /100 | #295 | Tragic 94.6% |
| Cubans | 0.0 /100 | #296 | Tragic 94.6% |
Demographics Similar to Immigrants from Scotland by 7th Grade
In terms of 7th grade, the demographic groups most similar to Immigrants from Scotland are Slavic (97.1%, a difference of 0.0%), Celtic (97.1%, a difference of 0.010%), Bulgarian (97.1%, a difference of 0.020%), Estonian (97.0%, a difference of 0.030%), and Czechoslovakian (97.1%, a difference of 0.040%).
| Demographics | Rating | Rank | 7th Grade |
| Maltese | 99.9 /100 | #43 | Exceptional 97.1% |
| Northern Europeans | 99.9 /100 | #44 | Exceptional 97.1% |
| Czechoslovakians | 99.9 /100 | #45 | Exceptional 97.1% |
| Aleuts | 99.9 /100 | #46 | Exceptional 97.1% |
| Bulgarians | 99.9 /100 | #47 | Exceptional 97.1% |
| Celtics | 99.9 /100 | #48 | Exceptional 97.1% |
| Slavs | 99.9 /100 | #49 | Exceptional 97.1% |
| Immigrants | Scotland | 99.9 /100 | #50 | Exceptional 97.1% |
| Estonians | 99.9 /100 | #51 | Exceptional 97.0% |
| Greeks | 99.9 /100 | #52 | Exceptional 97.0% |
| Austrians | 99.8 /100 | #53 | Exceptional 97.0% |
| Australians | 99.8 /100 | #54 | Exceptional 97.0% |
| Russians | 99.8 /100 | #55 | Exceptional 97.0% |
| Serbians | 99.8 /100 | #56 | Exceptional 97.0% |
| Americans | 99.8 /100 | #57 | Exceptional 97.0% |