Uruguayan vs Immigrants from Scotland 7th Grade
COMPARE
Uruguayan
Immigrants from Scotland
7th Grade
7th Grade Comparison
Uruguayans
Immigrants from Scotland
95.4%
7TH GRADE
1.6/ 100
METRIC RATING
244th/ 347
METRIC RANK
97.1%
7TH GRADE
99.9/ 100
METRIC RATING
50th/ 347
METRIC RANK
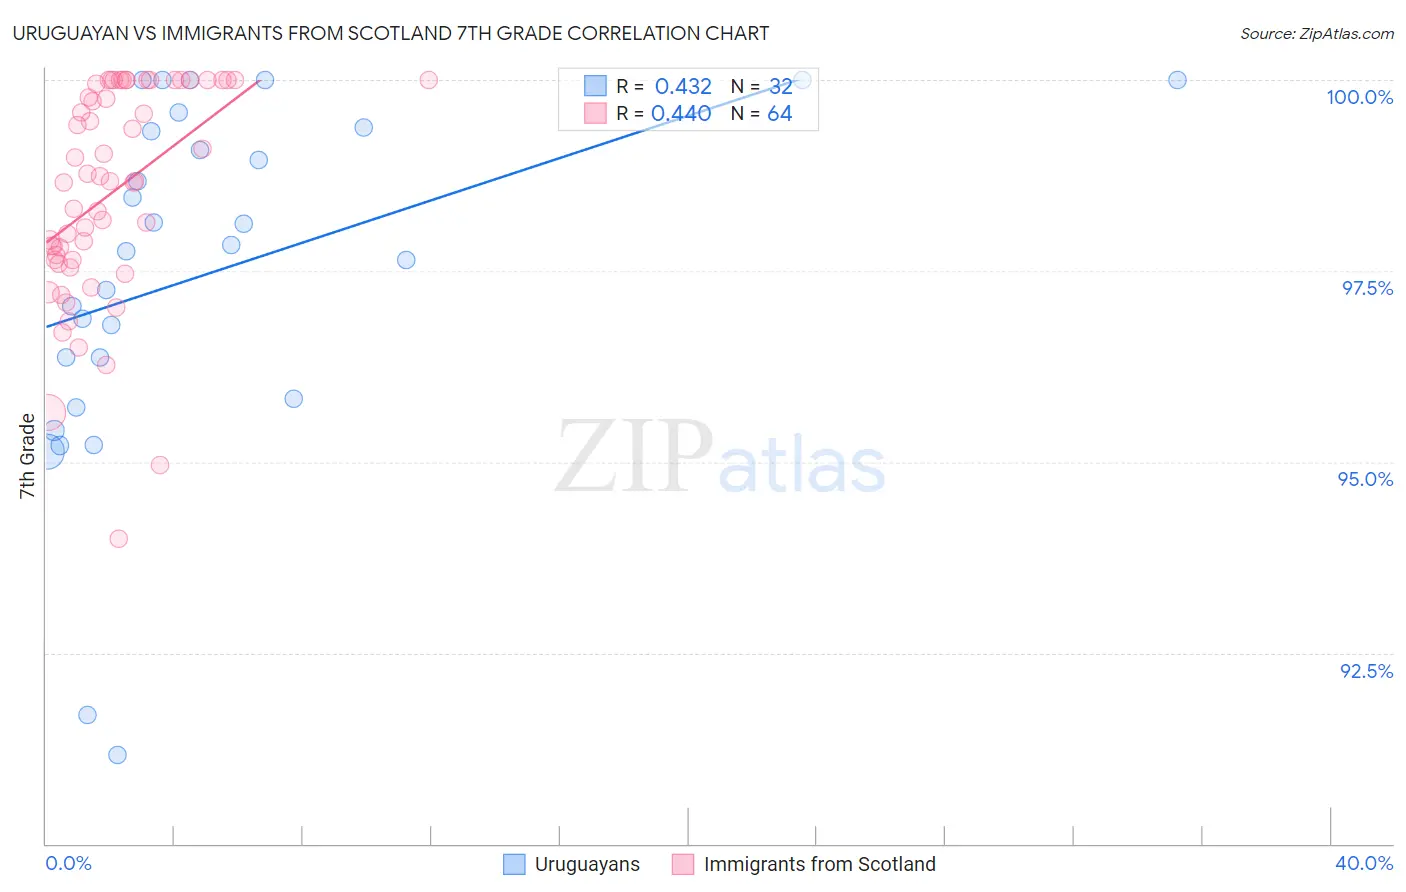
Uruguayan vs Immigrants from Scotland 7th Grade Correlation Chart
The statistical analysis conducted on geographies consisting of 144,782,794 people shows a moderate positive correlation between the proportion of Uruguayans and percentage of population with at least 7th grade education in the United States with a correlation coefficient (R) of 0.432 and weighted average of 95.4%. Similarly, the statistical analysis conducted on geographies consisting of 196,398,887 people shows a moderate positive correlation between the proportion of Immigrants from Scotland and percentage of population with at least 7th grade education in the United States with a correlation coefficient (R) of 0.440 and weighted average of 97.1%, a difference of 1.7%.
7th Grade Correlation Summary
| Measurement | Uruguayan | Immigrants from Scotland |
| Minimum | 91.2% | 94.0% |
| Maximum | 100.0% | 100.0% |
| Range | 8.8% | 6.0% |
| Mean | 97.5% | 98.5% |
| Median | 97.8% | 98.7% |
| Interquartile 25% (IQ1) | 96.1% | 97.6% |
| Interquartile 75% (IQ3) | 99.3% | 100.0% |
| Interquartile Range (IQR) | 3.3% | 2.4% |
| Standard Deviation (Sample) | 2.3% | 1.4% |
| Standard Deviation (Population) | 2.2% | 1.4% |
Similar Demographics by 7th Grade
Demographics Similar to Uruguayans by 7th Grade
In terms of 7th grade, the demographic groups most similar to Uruguayans are U.S. Virgin Islander (95.4%, a difference of 0.0%), Immigrants from Middle Africa (95.4%, a difference of 0.010%), Ethiopian (95.4%, a difference of 0.010%), Immigrants from Sierra Leone (95.5%, a difference of 0.030%), and South American Indian (95.5%, a difference of 0.030%).
| Demographics | Rating | Rank | 7th Grade |
| Immigrants | Asia | 2.3 /100 | #237 | Tragic 95.5% |
| Indians (Asian) | 2.3 /100 | #238 | Tragic 95.5% |
| Jamaicans | 2.2 /100 | #239 | Tragic 95.5% |
| Immigrants | Sierra Leone | 2.0 /100 | #240 | Tragic 95.5% |
| South American Indians | 2.0 /100 | #241 | Tragic 95.5% |
| Immigrants | Senegal | 1.9 /100 | #242 | Tragic 95.5% |
| U.S. Virgin Islanders | 1.6 /100 | #243 | Tragic 95.4% |
| Uruguayans | 1.6 /100 | #244 | Tragic 95.4% |
| Immigrants | Middle Africa | 1.5 /100 | #245 | Tragic 95.4% |
| Ethiopians | 1.5 /100 | #246 | Tragic 95.4% |
| Tongans | 1.3 /100 | #247 | Tragic 95.4% |
| Paiute | 1.2 /100 | #248 | Tragic 95.4% |
| Bolivians | 1.1 /100 | #249 | Tragic 95.4% |
| Immigrants | Cameroon | 0.9 /100 | #250 | Tragic 95.4% |
| Immigrants | Jamaica | 0.9 /100 | #251 | Tragic 95.4% |
Demographics Similar to Immigrants from Scotland by 7th Grade
In terms of 7th grade, the demographic groups most similar to Immigrants from Scotland are Slavic (97.1%, a difference of 0.0%), Celtic (97.1%, a difference of 0.010%), Bulgarian (97.1%, a difference of 0.020%), Estonian (97.0%, a difference of 0.030%), and Czechoslovakian (97.1%, a difference of 0.040%).
| Demographics | Rating | Rank | 7th Grade |
| Maltese | 99.9 /100 | #43 | Exceptional 97.1% |
| Northern Europeans | 99.9 /100 | #44 | Exceptional 97.1% |
| Czechoslovakians | 99.9 /100 | #45 | Exceptional 97.1% |
| Aleuts | 99.9 /100 | #46 | Exceptional 97.1% |
| Bulgarians | 99.9 /100 | #47 | Exceptional 97.1% |
| Celtics | 99.9 /100 | #48 | Exceptional 97.1% |
| Slavs | 99.9 /100 | #49 | Exceptional 97.1% |
| Immigrants | Scotland | 99.9 /100 | #50 | Exceptional 97.1% |
| Estonians | 99.9 /100 | #51 | Exceptional 97.0% |
| Greeks | 99.9 /100 | #52 | Exceptional 97.0% |
| Austrians | 99.8 /100 | #53 | Exceptional 97.0% |
| Australians | 99.8 /100 | #54 | Exceptional 97.0% |
| Russians | 99.8 /100 | #55 | Exceptional 97.0% |
| Serbians | 99.8 /100 | #56 | Exceptional 97.0% |
| Americans | 99.8 /100 | #57 | Exceptional 97.0% |