Taiwanese vs Immigrants from Scotland Family Households with Children
COMPARE
Taiwanese
Immigrants from Scotland
Family Households with Children
Family Households with Children Comparison
Taiwanese
Immigrants from Scotland
26.7%
FAMILY HOUSEHOLDS WITH CHILDREN
0.9/ 100
METRIC RATING
264th/ 347
METRIC RANK
26.8%
FAMILY HOUSEHOLDS WITH CHILDREN
1.5/ 100
METRIC RATING
254th/ 347
METRIC RANK
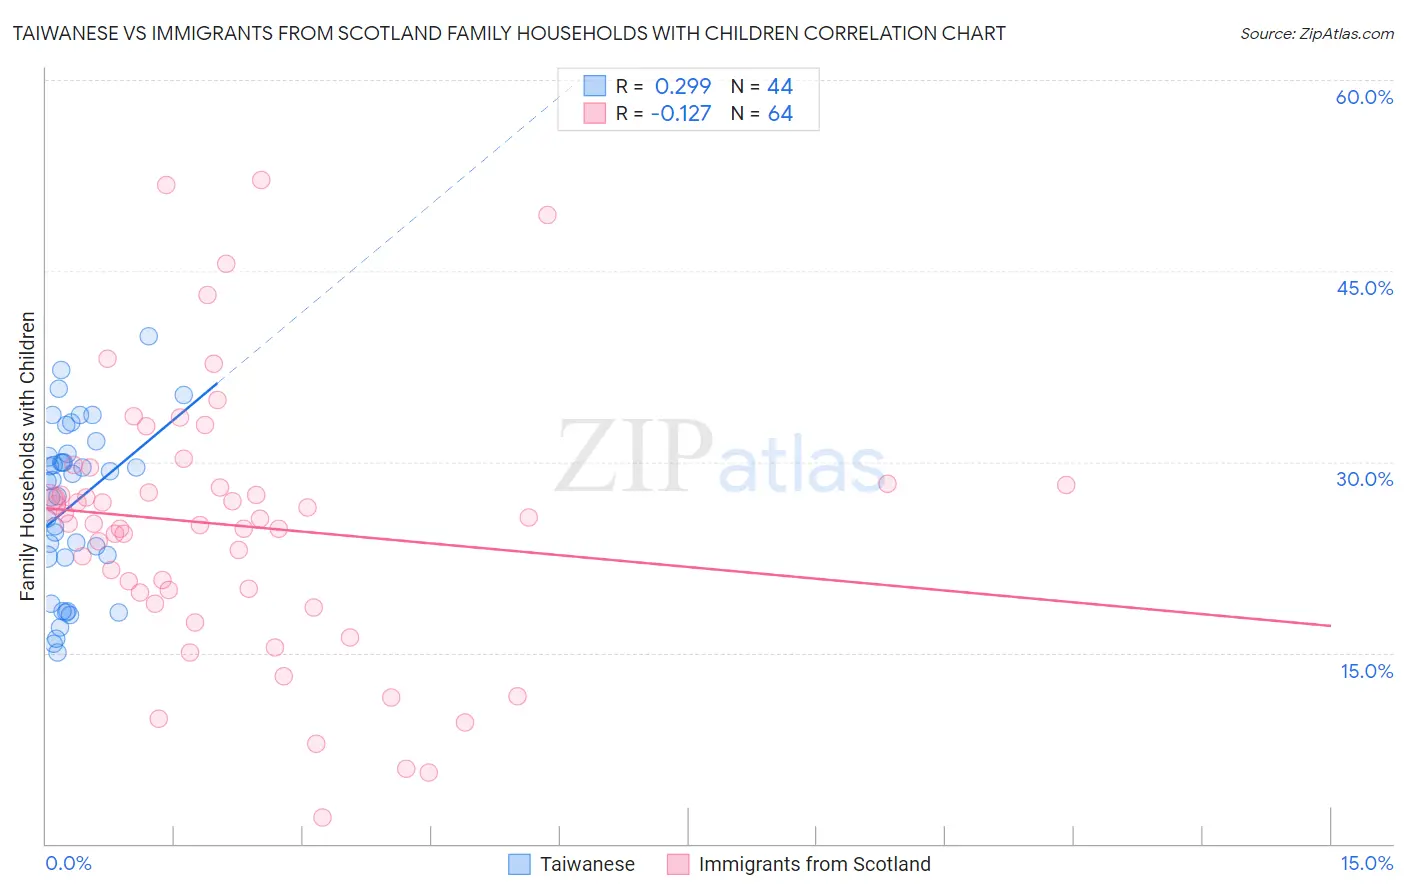
Taiwanese vs Immigrants from Scotland Family Households with Children Correlation Chart
The statistical analysis conducted on geographies consisting of 31,709,765 people shows a weak positive correlation between the proportion of Taiwanese and percentage of family households with children in the United States with a correlation coefficient (R) of 0.299 and weighted average of 26.7%. Similarly, the statistical analysis conducted on geographies consisting of 196,363,722 people shows a poor negative correlation between the proportion of Immigrants from Scotland and percentage of family households with children in the United States with a correlation coefficient (R) of -0.127 and weighted average of 26.8%, a difference of 0.27%.
Family Households with Children Correlation Summary
| Measurement | Taiwanese | Immigrants from Scotland |
| Minimum | 15.0% | 2.1% |
| Maximum | 39.9% | 52.1% |
| Range | 24.9% | 50.1% |
| Mean | 26.7% | 25.0% |
| Median | 28.5% | 25.4% |
| Interquartile 25% (IQ1) | 22.5% | 19.9% |
| Interquartile 75% (IQ3) | 30.5% | 28.3% |
| Interquartile Range (IQR) | 8.0% | 8.4% |
| Standard Deviation (Sample) | 6.4% | 10.3% |
| Standard Deviation (Population) | 6.4% | 10.2% |
Demographics Similar to Taiwanese and Immigrants from Scotland by Family Households with Children
In terms of family households with children, the demographic groups most similar to Taiwanese are Chippewa (26.7%, a difference of 0.010%), Maltese (26.7%, a difference of 0.010%), Immigrants from Uzbekistan (26.7%, a difference of 0.010%), Immigrants from Belgium (26.7%, a difference of 0.020%), and Immigrants from North Macedonia (26.7%, a difference of 0.030%). Similarly, the demographic groups most similar to Immigrants from Scotland are German Russian (26.8%, a difference of 0.0%), Scotch-Irish (26.8%, a difference of 0.020%), Italian (26.8%, a difference of 0.030%), Slavic (26.8%, a difference of 0.070%), and Immigrants from Cuba (26.8%, a difference of 0.070%).
| Demographics | Rating | Rank | Family Households with Children |
| Immigrants | Eastern Europe | 2.1 /100 | #249 | Tragic 26.9% |
| Belgians | 2.1 /100 | #250 | Tragic 26.9% |
| Immigrants | Bosnia and Herzegovina | 1.9 /100 | #251 | Tragic 26.8% |
| Irish | 1.8 /100 | #252 | Tragic 26.8% |
| Italians | 1.5 /100 | #253 | Tragic 26.8% |
| Immigrants | Scotland | 1.5 /100 | #254 | Tragic 26.8% |
| German Russians | 1.5 /100 | #255 | Tragic 26.8% |
| Scotch-Irish | 1.4 /100 | #256 | Tragic 26.8% |
| Slavs | 1.3 /100 | #257 | Tragic 26.8% |
| Immigrants | Cuba | 1.3 /100 | #258 | Tragic 26.8% |
| Immigrants | Lithuania | 1.2 /100 | #259 | Tragic 26.8% |
| Immigrants | Jamaica | 1.2 /100 | #260 | Tragic 26.8% |
| Immigrants | Belarus | 1.1 /100 | #261 | Tragic 26.8% |
| Immigrants | Russia | 1.0 /100 | #262 | Tragic 26.8% |
| Immigrants | North Macedonia | 1.0 /100 | #263 | Tragic 26.7% |
| Taiwanese | 0.9 /100 | #264 | Tragic 26.7% |
| Chippewa | 0.9 /100 | #265 | Tragic 26.7% |
| Maltese | 0.9 /100 | #266 | Tragic 26.7% |
| Immigrants | Uzbekistan | 0.9 /100 | #267 | Tragic 26.7% |
| Immigrants | Belgium | 0.9 /100 | #268 | Tragic 26.7% |
| Immigrants | Denmark | 0.8 /100 | #269 | Tragic 26.7% |