Taiwanese vs Immigrants from Iran 7th Grade
COMPARE
Taiwanese
Immigrants from Iran
7th Grade
7th Grade Comparison
Taiwanese
Immigrants from Iran
94.8%
7TH GRADE
0.0/ 100
METRIC RATING
289th/ 347
METRIC RANK
96.0%
7TH GRADE
47.8/ 100
METRIC RATING
179th/ 347
METRIC RANK
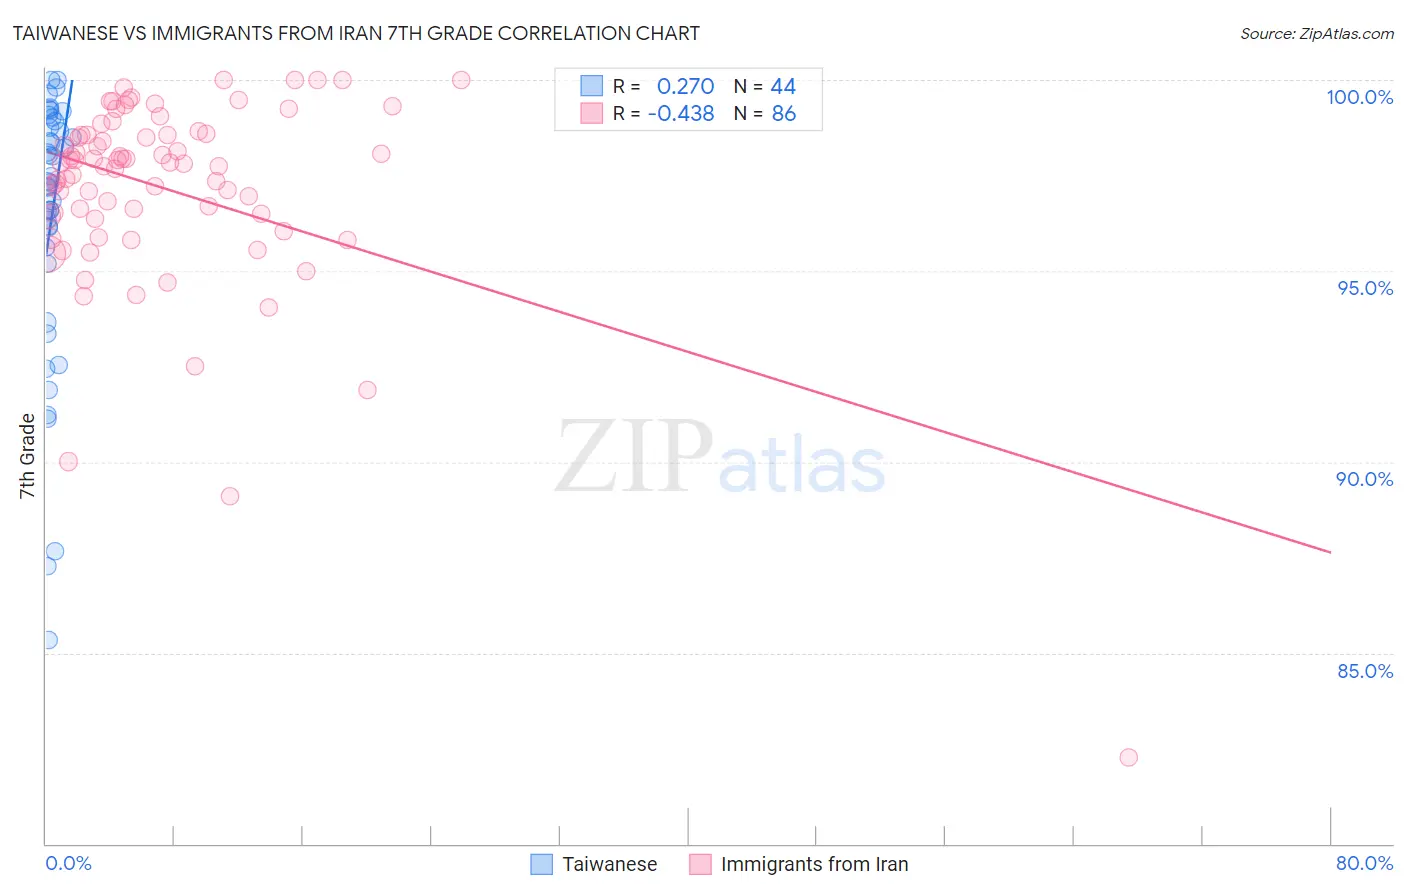
Taiwanese vs Immigrants from Iran 7th Grade Correlation Chart
The statistical analysis conducted on geographies consisting of 31,724,936 people shows a weak positive correlation between the proportion of Taiwanese and percentage of population with at least 7th grade education in the United States with a correlation coefficient (R) of 0.270 and weighted average of 94.8%. Similarly, the statistical analysis conducted on geographies consisting of 279,867,553 people shows a moderate negative correlation between the proportion of Immigrants from Iran and percentage of population with at least 7th grade education in the United States with a correlation coefficient (R) of -0.438 and weighted average of 96.0%, a difference of 1.3%.
7th Grade Correlation Summary
| Measurement | Taiwanese | Immigrants from Iran |
| Minimum | 85.3% | 82.3% |
| Maximum | 100.0% | 100.0% |
| Range | 14.7% | 17.7% |
| Mean | 96.3% | 97.1% |
| Median | 97.3% | 97.8% |
| Interquartile 25% (IQ1) | 95.4% | 96.4% |
| Interquartile 75% (IQ3) | 98.8% | 98.6% |
| Interquartile Range (IQR) | 3.4% | 2.1% |
| Standard Deviation (Sample) | 3.6% | 2.6% |
| Standard Deviation (Population) | 3.5% | 2.6% |
Similar Demographics by 7th Grade
Demographics Similar to Taiwanese by 7th Grade
In terms of 7th grade, the demographic groups most similar to Taiwanese are British West Indian (94.8%, a difference of 0.010%), Malaysian (94.8%, a difference of 0.020%), Immigrants from Peru (94.9%, a difference of 0.030%), Immigrants from Philippines (94.9%, a difference of 0.040%), and Immigrants from Grenada (94.8%, a difference of 0.060%).
| Demographics | Rating | Rank | 7th Grade |
| Immigrants | Bolivia | 0.1 /100 | #282 | Tragic 95.0% |
| Immigrants | Barbados | 0.1 /100 | #283 | Tragic 95.0% |
| Armenians | 0.1 /100 | #284 | Tragic 95.0% |
| Immigrants | Eritrea | 0.1 /100 | #285 | Tragic 94.9% |
| Immigrants | Philippines | 0.0 /100 | #286 | Tragic 94.9% |
| Immigrants | Peru | 0.0 /100 | #287 | Tragic 94.9% |
| British West Indians | 0.0 /100 | #288 | Tragic 94.8% |
| Taiwanese | 0.0 /100 | #289 | Tragic 94.8% |
| Malaysians | 0.0 /100 | #290 | Tragic 94.8% |
| Immigrants | Grenada | 0.0 /100 | #291 | Tragic 94.8% |
| Immigrants | West Indies | 0.0 /100 | #292 | Tragic 94.8% |
| Fijians | 0.0 /100 | #293 | Tragic 94.7% |
| Haitians | 0.0 /100 | #294 | Tragic 94.7% |
| Yaqui | 0.0 /100 | #295 | Tragic 94.6% |
| Cubans | 0.0 /100 | #296 | Tragic 94.6% |
Demographics Similar to Immigrants from Iran by 7th Grade
In terms of 7th grade, the demographic groups most similar to Immigrants from Iran are Marshallese (96.0%, a difference of 0.0%), Mongolian (96.0%, a difference of 0.010%), Black/African American (96.0%, a difference of 0.010%), Chilean (96.0%, a difference of 0.010%), and Immigrants from Korea (96.0%, a difference of 0.010%).
| Demographics | Rating | Rank | 7th Grade |
| Venezuelans | 51.4 /100 | #172 | Average 96.0% |
| Immigrants | Albania | 50.4 /100 | #173 | Average 96.0% |
| Mongolians | 50.0 /100 | #174 | Average 96.0% |
| Blacks/African Americans | 49.5 /100 | #175 | Average 96.0% |
| Chileans | 49.3 /100 | #176 | Average 96.0% |
| Immigrants | Korea | 49.2 /100 | #177 | Average 96.0% |
| Marshallese | 48.4 /100 | #178 | Average 96.0% |
| Immigrants | Iran | 47.8 /100 | #179 | Average 96.0% |
| Immigrants | Brazil | 46.8 /100 | #180 | Average 96.0% |
| Pakistanis | 44.5 /100 | #181 | Average 96.0% |
| Iraqis | 41.2 /100 | #182 | Average 96.0% |
| Immigrants | Spain | 38.8 /100 | #183 | Fair 96.0% |
| Sierra Leoneans | 37.5 /100 | #184 | Fair 96.0% |
| Brazilians | 37.3 /100 | #185 | Fair 96.0% |
| Immigrants | Iraq | 36.1 /100 | #186 | Fair 96.0% |