Taiwanese vs Immigrants from Cabo Verde 7th Grade
COMPARE
Taiwanese
Immigrants from Cabo Verde
7th Grade
7th Grade Comparison
Taiwanese
Immigrants from Cabo Verde
94.8%
7TH GRADE
0.0/ 100
METRIC RATING
289th/ 347
METRIC RANK
93.1%
7TH GRADE
0.0/ 100
METRIC RATING
327th/ 347
METRIC RANK
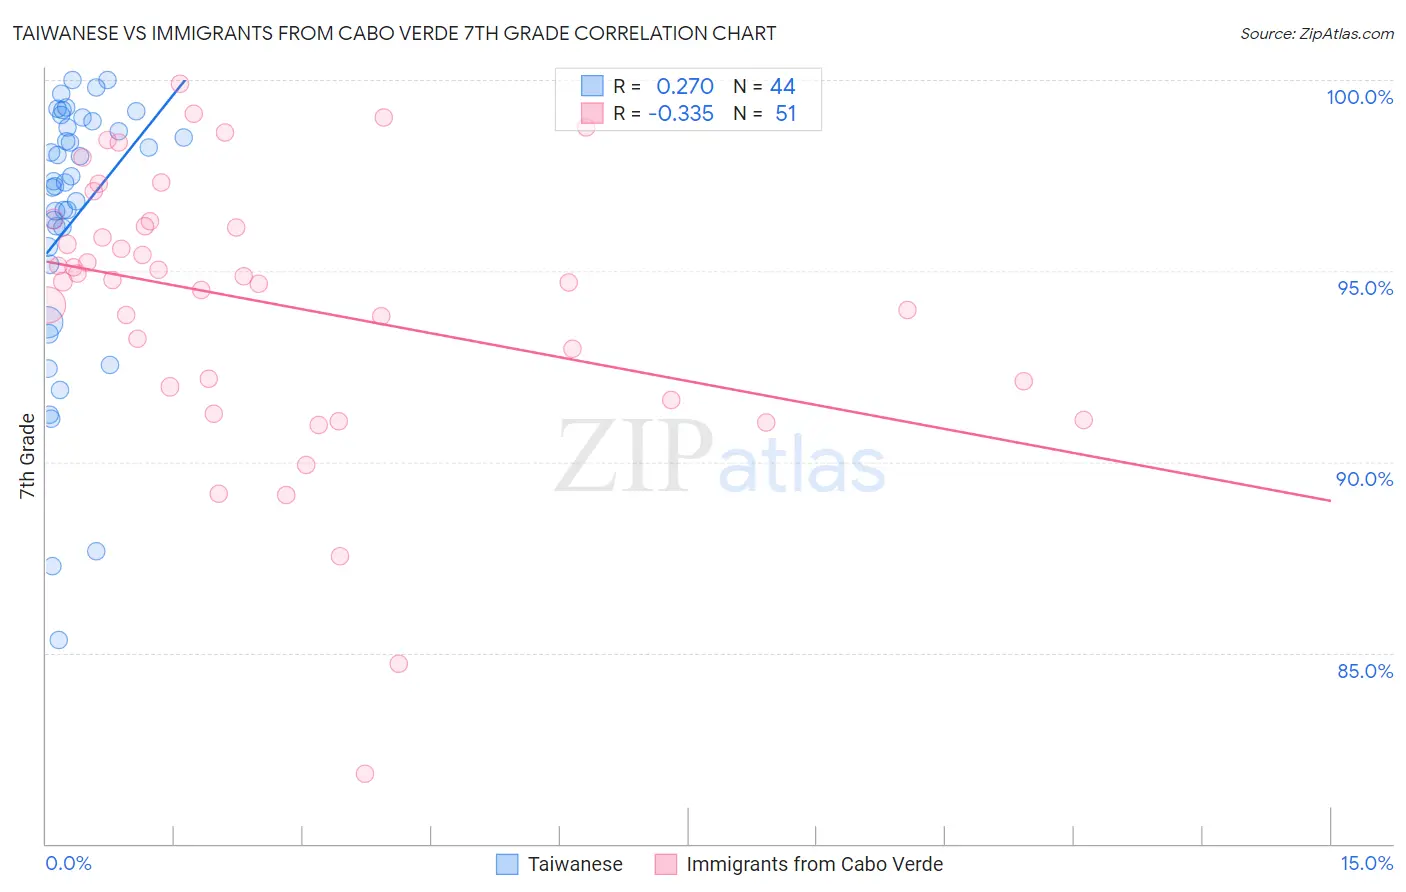
Taiwanese vs Immigrants from Cabo Verde 7th Grade Correlation Chart
The statistical analysis conducted on geographies consisting of 31,724,936 people shows a weak positive correlation between the proportion of Taiwanese and percentage of population with at least 7th grade education in the United States with a correlation coefficient (R) of 0.270 and weighted average of 94.8%. Similarly, the statistical analysis conducted on geographies consisting of 38,158,316 people shows a mild negative correlation between the proportion of Immigrants from Cabo Verde and percentage of population with at least 7th grade education in the United States with a correlation coefficient (R) of -0.335 and weighted average of 93.1%, a difference of 1.9%.
7th Grade Correlation Summary
| Measurement | Taiwanese | Immigrants from Cabo Verde |
| Minimum | 85.3% | 81.8% |
| Maximum | 100.0% | 99.9% |
| Range | 14.7% | 18.1% |
| Mean | 96.3% | 94.1% |
| Median | 97.3% | 94.8% |
| Interquartile 25% (IQ1) | 95.4% | 92.0% |
| Interquartile 75% (IQ3) | 98.8% | 96.3% |
| Interquartile Range (IQR) | 3.4% | 4.3% |
| Standard Deviation (Sample) | 3.6% | 3.6% |
| Standard Deviation (Population) | 3.5% | 3.6% |
Similar Demographics by 7th Grade
Demographics Similar to Taiwanese by 7th Grade
In terms of 7th grade, the demographic groups most similar to Taiwanese are British West Indian (94.8%, a difference of 0.010%), Malaysian (94.8%, a difference of 0.020%), Immigrants from Peru (94.9%, a difference of 0.030%), Immigrants from Philippines (94.9%, a difference of 0.040%), and Immigrants from Grenada (94.8%, a difference of 0.060%).
| Demographics | Rating | Rank | 7th Grade |
| Immigrants | Bolivia | 0.1 /100 | #282 | Tragic 95.0% |
| Immigrants | Barbados | 0.1 /100 | #283 | Tragic 95.0% |
| Armenians | 0.1 /100 | #284 | Tragic 95.0% |
| Immigrants | Eritrea | 0.1 /100 | #285 | Tragic 94.9% |
| Immigrants | Philippines | 0.0 /100 | #286 | Tragic 94.9% |
| Immigrants | Peru | 0.0 /100 | #287 | Tragic 94.9% |
| British West Indians | 0.0 /100 | #288 | Tragic 94.8% |
| Taiwanese | 0.0 /100 | #289 | Tragic 94.8% |
| Malaysians | 0.0 /100 | #290 | Tragic 94.8% |
| Immigrants | Grenada | 0.0 /100 | #291 | Tragic 94.8% |
| Immigrants | West Indies | 0.0 /100 | #292 | Tragic 94.8% |
| Fijians | 0.0 /100 | #293 | Tragic 94.7% |
| Haitians | 0.0 /100 | #294 | Tragic 94.7% |
| Yaqui | 0.0 /100 | #295 | Tragic 94.6% |
| Cubans | 0.0 /100 | #296 | Tragic 94.6% |
Demographics Similar to Immigrants from Cabo Verde by 7th Grade
In terms of 7th grade, the demographic groups most similar to Immigrants from Cabo Verde are Nepalese (93.2%, a difference of 0.070%), Immigrants from Nicaragua (93.0%, a difference of 0.13%), Immigrants from the Azores (93.0%, a difference of 0.17%), Central American Indian (93.3%, a difference of 0.18%), and Immigrants from Dominican Republic (92.9%, a difference of 0.22%).
| Demographics | Rating | Rank | 7th Grade |
| Immigrants | Fiji | 0.0 /100 | #320 | Tragic 93.5% |
| Belizeans | 0.0 /100 | #321 | Tragic 93.5% |
| Nicaraguans | 0.0 /100 | #322 | Tragic 93.5% |
| Immigrants | Belize | 0.0 /100 | #323 | Tragic 93.4% |
| Dominicans | 0.0 /100 | #324 | Tragic 93.3% |
| Central American Indians | 0.0 /100 | #325 | Tragic 93.3% |
| Nepalese | 0.0 /100 | #326 | Tragic 93.2% |
| Immigrants | Cabo Verde | 0.0 /100 | #327 | Tragic 93.1% |
| Immigrants | Nicaragua | 0.0 /100 | #328 | Tragic 93.0% |
| Immigrants | Azores | 0.0 /100 | #329 | Tragic 93.0% |
| Immigrants | Dominican Republic | 0.0 /100 | #330 | Tragic 92.9% |
| Hondurans | 0.0 /100 | #331 | Tragic 92.9% |
| Hispanics or Latinos | 0.0 /100 | #332 | Tragic 92.7% |
| Immigrants | Armenia | 0.0 /100 | #333 | Tragic 92.7% |
| Immigrants | Yemen | 0.0 /100 | #334 | Tragic 92.6% |