Immigrants from Russia vs Immigrants from Scotland 7th Grade
COMPARE
Immigrants from Russia
Immigrants from Scotland
7th Grade
7th Grade Comparison
Immigrants from Russia
Immigrants from Scotland
96.2%
7TH GRADE
78.4/ 100
METRIC RATING
152nd/ 347
METRIC RANK
97.1%
7TH GRADE
99.9/ 100
METRIC RATING
50th/ 347
METRIC RANK
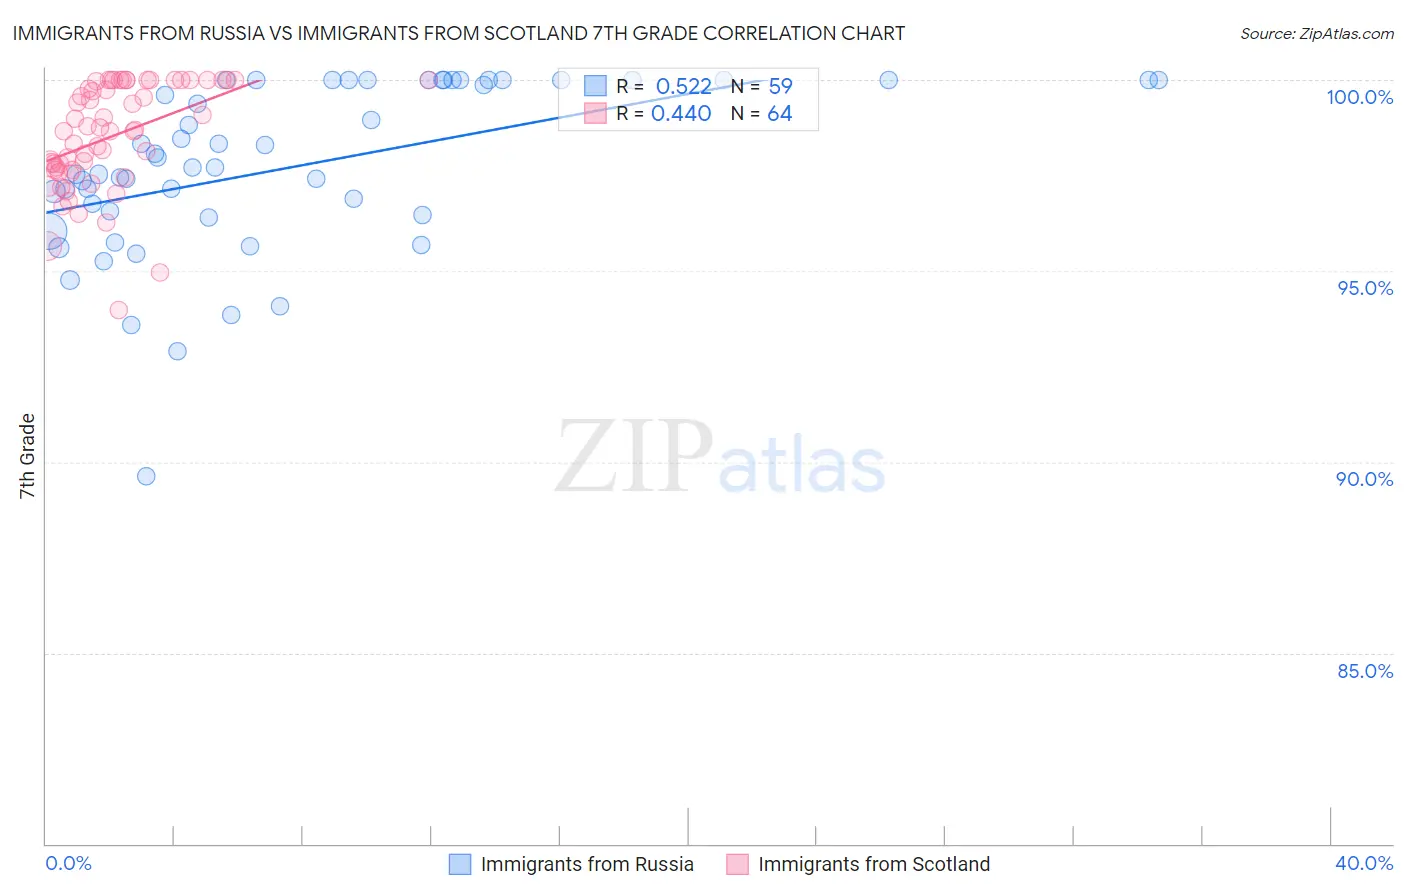
Immigrants from Russia vs Immigrants from Scotland 7th Grade Correlation Chart
The statistical analysis conducted on geographies consisting of 347,948,494 people shows a substantial positive correlation between the proportion of Immigrants from Russia and percentage of population with at least 7th grade education in the United States with a correlation coefficient (R) of 0.522 and weighted average of 96.2%. Similarly, the statistical analysis conducted on geographies consisting of 196,398,887 people shows a moderate positive correlation between the proportion of Immigrants from Scotland and percentage of population with at least 7th grade education in the United States with a correlation coefficient (R) of 0.440 and weighted average of 97.1%, a difference of 0.86%.
7th Grade Correlation Summary
| Measurement | Immigrants from Russia | Immigrants from Scotland |
| Minimum | 89.6% | 94.0% |
| Maximum | 100.0% | 100.0% |
| Range | 10.4% | 6.0% |
| Mean | 97.7% | 98.5% |
| Median | 97.7% | 98.7% |
| Interquartile 25% (IQ1) | 96.5% | 97.6% |
| Interquartile 75% (IQ3) | 100.0% | 100.0% |
| Interquartile Range (IQR) | 3.5% | 2.4% |
| Standard Deviation (Sample) | 2.2% | 1.4% |
| Standard Deviation (Population) | 2.2% | 1.4% |
Similar Demographics by 7th Grade
Demographics Similar to Immigrants from Russia by 7th Grade
In terms of 7th grade, the demographic groups most similar to Immigrants from Russia are Seminole (96.2%, a difference of 0.0%), Immigrants from Israel (96.2%, a difference of 0.010%), Immigrants from Jordan (96.2%, a difference of 0.010%), Kenyan (96.2%, a difference of 0.020%), and Hopi (96.3%, a difference of 0.030%).
| Demographics | Rating | Rank | 7th Grade |
| Blackfeet | 83.9 /100 | #145 | Excellent 96.3% |
| Immigrants | Eastern Europe | 83.7 /100 | #146 | Excellent 96.3% |
| French American Indians | 83.1 /100 | #147 | Excellent 96.3% |
| Israelis | 82.8 /100 | #148 | Excellent 96.3% |
| Albanians | 82.6 /100 | #149 | Excellent 96.3% |
| Immigrants | Belarus | 82.4 /100 | #150 | Excellent 96.3% |
| Hopi | 81.6 /100 | #151 | Excellent 96.3% |
| Immigrants | Russia | 78.4 /100 | #152 | Good 96.2% |
| Seminole | 78.1 /100 | #153 | Good 96.2% |
| Immigrants | Israel | 77.6 /100 | #154 | Good 96.2% |
| Immigrants | Jordan | 77.0 /100 | #155 | Good 96.2% |
| Kenyans | 76.2 /100 | #156 | Good 96.2% |
| Ugandans | 75.5 /100 | #157 | Good 96.2% |
| Arabs | 68.6 /100 | #158 | Good 96.2% |
| Alsatians | 67.2 /100 | #159 | Good 96.1% |
Demographics Similar to Immigrants from Scotland by 7th Grade
In terms of 7th grade, the demographic groups most similar to Immigrants from Scotland are Slavic (97.1%, a difference of 0.0%), Celtic (97.1%, a difference of 0.010%), Bulgarian (97.1%, a difference of 0.020%), Estonian (97.0%, a difference of 0.030%), and Czechoslovakian (97.1%, a difference of 0.040%).
| Demographics | Rating | Rank | 7th Grade |
| Maltese | 99.9 /100 | #43 | Exceptional 97.1% |
| Northern Europeans | 99.9 /100 | #44 | Exceptional 97.1% |
| Czechoslovakians | 99.9 /100 | #45 | Exceptional 97.1% |
| Aleuts | 99.9 /100 | #46 | Exceptional 97.1% |
| Bulgarians | 99.9 /100 | #47 | Exceptional 97.1% |
| Celtics | 99.9 /100 | #48 | Exceptional 97.1% |
| Slavs | 99.9 /100 | #49 | Exceptional 97.1% |
| Immigrants | Scotland | 99.9 /100 | #50 | Exceptional 97.1% |
| Estonians | 99.9 /100 | #51 | Exceptional 97.0% |
| Greeks | 99.9 /100 | #52 | Exceptional 97.0% |
| Austrians | 99.8 /100 | #53 | Exceptional 97.0% |
| Australians | 99.8 /100 | #54 | Exceptional 97.0% |
| Russians | 99.8 /100 | #55 | Exceptional 97.0% |
| Serbians | 99.8 /100 | #56 | Exceptional 97.0% |
| Americans | 99.8 /100 | #57 | Exceptional 97.0% |