African vs Immigrants from Scotland 7th Grade
COMPARE
African
Immigrants from Scotland
7th Grade
7th Grade Comparison
Africans
Immigrants from Scotland
95.8%
7TH GRADE
17.6/ 100
METRIC RATING
206th/ 347
METRIC RANK
97.1%
7TH GRADE
99.9/ 100
METRIC RATING
50th/ 347
METRIC RANK
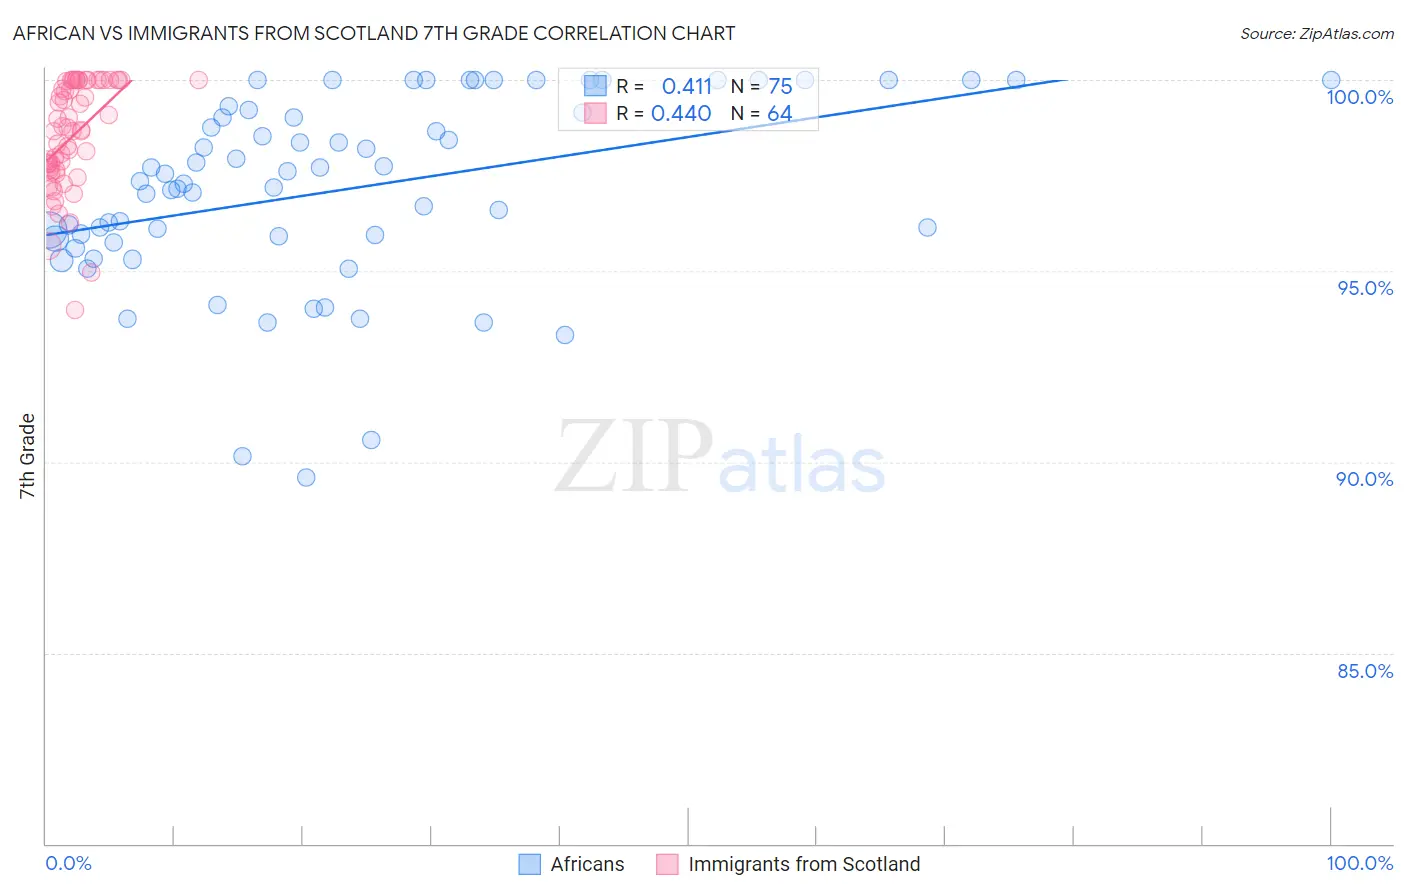
African vs Immigrants from Scotland 7th Grade Correlation Chart
The statistical analysis conducted on geographies consisting of 470,094,744 people shows a moderate positive correlation between the proportion of Africans and percentage of population with at least 7th grade education in the United States with a correlation coefficient (R) of 0.411 and weighted average of 95.8%. Similarly, the statistical analysis conducted on geographies consisting of 196,398,887 people shows a moderate positive correlation between the proportion of Immigrants from Scotland and percentage of population with at least 7th grade education in the United States with a correlation coefficient (R) of 0.440 and weighted average of 97.1%, a difference of 1.3%.
7th Grade Correlation Summary
| Measurement | African | Immigrants from Scotland |
| Minimum | 89.6% | 94.0% |
| Maximum | 100.0% | 100.0% |
| Range | 10.4% | 6.0% |
| Mean | 97.1% | 98.5% |
| Median | 97.3% | 98.7% |
| Interquartile 25% (IQ1) | 95.9% | 97.6% |
| Interquartile 75% (IQ3) | 99.2% | 100.0% |
| Interquartile Range (IQR) | 3.4% | 2.4% |
| Standard Deviation (Sample) | 2.5% | 1.4% |
| Standard Deviation (Population) | 2.5% | 1.4% |
Similar Demographics by 7th Grade
Demographics Similar to Africans by 7th Grade
In terms of 7th grade, the demographic groups most similar to Africans are Moroccan (95.8%, a difference of 0.010%), Navajo (95.8%, a difference of 0.010%), Immigrants from Sudan (95.8%, a difference of 0.010%), Dutch West Indian (95.8%, a difference of 0.020%), and Hawaiian (95.8%, a difference of 0.020%).
| Demographics | Rating | Rank | 7th Grade |
| Guamanians/Chamorros | 23.5 /100 | #199 | Fair 95.9% |
| Argentineans | 23.2 /100 | #200 | Fair 95.9% |
| Immigrants | Argentina | 21.9 /100 | #201 | Fair 95.9% |
| Immigrants | Northern Africa | 21.4 /100 | #202 | Fair 95.8% |
| Comanche | 21.1 /100 | #203 | Fair 95.8% |
| Assyrians/Chaldeans/Syriacs | 20.5 /100 | #204 | Fair 95.8% |
| Moroccans | 18.9 /100 | #205 | Poor 95.8% |
| Africans | 17.6 /100 | #206 | Poor 95.8% |
| Navajo | 17.0 /100 | #207 | Poor 95.8% |
| Immigrants | Sudan | 17.0 /100 | #208 | Poor 95.8% |
| Dutch West Indians | 16.1 /100 | #209 | Poor 95.8% |
| Hawaiians | 16.0 /100 | #210 | Poor 95.8% |
| Portuguese | 13.6 /100 | #211 | Poor 95.8% |
| Immigrants | Lebanon | 13.0 /100 | #212 | Poor 95.8% |
| Immigrants | Morocco | 12.6 /100 | #213 | Poor 95.8% |
Demographics Similar to Immigrants from Scotland by 7th Grade
In terms of 7th grade, the demographic groups most similar to Immigrants from Scotland are Slavic (97.1%, a difference of 0.0%), Celtic (97.1%, a difference of 0.010%), Bulgarian (97.1%, a difference of 0.020%), Estonian (97.0%, a difference of 0.030%), and Czechoslovakian (97.1%, a difference of 0.040%).
| Demographics | Rating | Rank | 7th Grade |
| Maltese | 99.9 /100 | #43 | Exceptional 97.1% |
| Northern Europeans | 99.9 /100 | #44 | Exceptional 97.1% |
| Czechoslovakians | 99.9 /100 | #45 | Exceptional 97.1% |
| Aleuts | 99.9 /100 | #46 | Exceptional 97.1% |
| Bulgarians | 99.9 /100 | #47 | Exceptional 97.1% |
| Celtics | 99.9 /100 | #48 | Exceptional 97.1% |
| Slavs | 99.9 /100 | #49 | Exceptional 97.1% |
| Immigrants | Scotland | 99.9 /100 | #50 | Exceptional 97.1% |
| Estonians | 99.9 /100 | #51 | Exceptional 97.0% |
| Greeks | 99.9 /100 | #52 | Exceptional 97.0% |
| Austrians | 99.8 /100 | #53 | Exceptional 97.0% |
| Australians | 99.8 /100 | #54 | Exceptional 97.0% |
| Russians | 99.8 /100 | #55 | Exceptional 97.0% |
| Serbians | 99.8 /100 | #56 | Exceptional 97.0% |
| Americans | 99.8 /100 | #57 | Exceptional 97.0% |