Taiwanese vs Immigrants from Scotland 3rd Grade
COMPARE
Taiwanese
Immigrants from Scotland
3rd Grade
3rd Grade Comparison
Taiwanese
Immigrants from Scotland
97.3%
3RD GRADE
0.3/ 100
METRIC RATING
263rd/ 347
METRIC RANK
98.3%
3RD GRADE
99.8/ 100
METRIC RATING
53rd/ 347
METRIC RANK
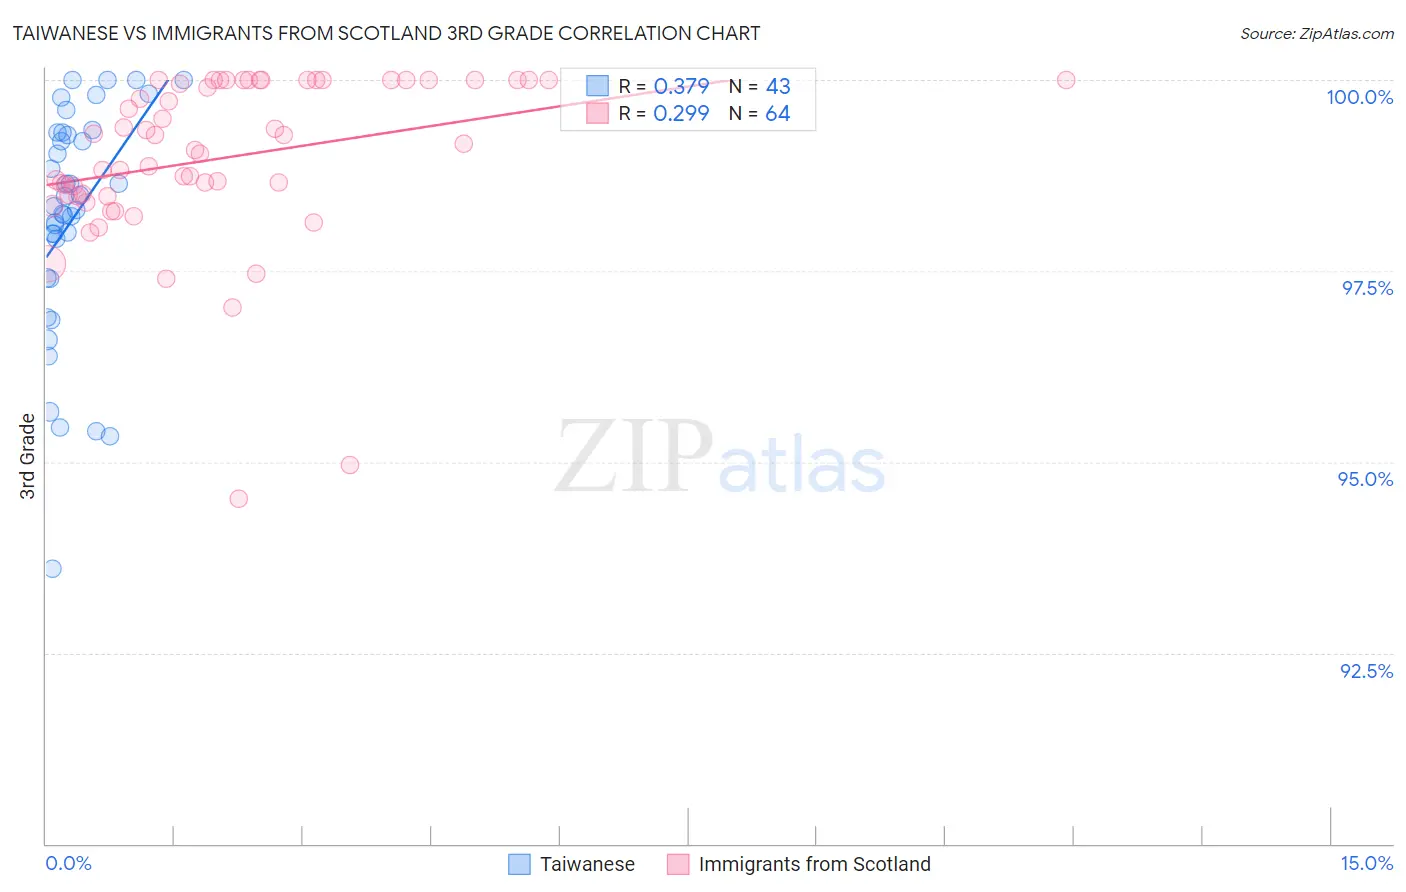
Taiwanese vs Immigrants from Scotland 3rd Grade Correlation Chart
The statistical analysis conducted on geographies consisting of 31,677,387 people shows a mild positive correlation between the proportion of Taiwanese and percentage of population with at least 3rd grade education in the United States with a correlation coefficient (R) of 0.379 and weighted average of 97.3%. Similarly, the statistical analysis conducted on geographies consisting of 196,398,887 people shows a weak positive correlation between the proportion of Immigrants from Scotland and percentage of population with at least 3rd grade education in the United States with a correlation coefficient (R) of 0.299 and weighted average of 98.3%, a difference of 1.0%.
3rd Grade Correlation Summary
| Measurement | Taiwanese | Immigrants from Scotland |
| Minimum | 93.6% | 94.5% |
| Maximum | 100.0% | 100.0% |
| Range | 6.4% | 5.5% |
| Mean | 98.2% | 99.0% |
| Median | 98.3% | 99.1% |
| Interquartile 25% (IQ1) | 97.4% | 98.5% |
| Interquartile 75% (IQ3) | 99.3% | 100.0% |
| Interquartile Range (IQR) | 1.9% | 1.5% |
| Standard Deviation (Sample) | 1.5% | 1.1% |
| Standard Deviation (Population) | 1.5% | 1.1% |
Similar Demographics by 3rd Grade
Demographics Similar to Taiwanese by 3rd Grade
In terms of 3rd grade, the demographic groups most similar to Taiwanese are Immigrants from Sierra Leone (97.3%, a difference of 0.0%), West Indian (97.3%, a difference of 0.0%), Immigrants from South America (97.3%, a difference of 0.010%), Immigrants from Jamaica (97.3%, a difference of 0.010%), and Armenian (97.3%, a difference of 0.020%).
| Demographics | Rating | Rank | 3rd Grade |
| Immigrants | Congo | 0.6 /100 | #256 | Tragic 97.3% |
| Immigrants | Colombia | 0.5 /100 | #257 | Tragic 97.3% |
| Immigrants | Liberia | 0.5 /100 | #258 | Tragic 97.3% |
| Armenians | 0.4 /100 | #259 | Tragic 97.3% |
| Immigrants | Ethiopia | 0.4 /100 | #260 | Tragic 97.3% |
| Immigrants | South America | 0.4 /100 | #261 | Tragic 97.3% |
| Immigrants | Sierra Leone | 0.4 /100 | #262 | Tragic 97.3% |
| Taiwanese | 0.3 /100 | #263 | Tragic 97.3% |
| West Indians | 0.3 /100 | #264 | Tragic 97.3% |
| Immigrants | Jamaica | 0.3 /100 | #265 | Tragic 97.3% |
| Yaqui | 0.3 /100 | #266 | Tragic 97.3% |
| Immigrants | Nigeria | 0.3 /100 | #267 | Tragic 97.3% |
| Cubans | 0.2 /100 | #268 | Tragic 97.3% |
| Fijians | 0.2 /100 | #269 | Tragic 97.3% |
| Immigrants | China | 0.2 /100 | #270 | Tragic 97.2% |
Demographics Similar to Immigrants from Scotland by 3rd Grade
In terms of 3rd grade, the demographic groups most similar to Immigrants from Scotland are Estonian (98.3%, a difference of 0.010%), Celtic (98.3%, a difference of 0.010%), Australian (98.3%, a difference of 0.010%), White/Caucasian (98.3%, a difference of 0.010%), and Bulgarian (98.3%, a difference of 0.010%).
| Demographics | Rating | Rank | 3rd Grade |
| Ottawa | 99.8 /100 | #46 | Exceptional 98.3% |
| Czechoslovakians | 99.8 /100 | #47 | Exceptional 98.3% |
| Lumbee | 99.8 /100 | #48 | Exceptional 98.3% |
| Estonians | 99.8 /100 | #49 | Exceptional 98.3% |
| Celtics | 99.8 /100 | #50 | Exceptional 98.3% |
| Australians | 99.8 /100 | #51 | Exceptional 98.3% |
| Whites/Caucasians | 99.8 /100 | #52 | Exceptional 98.3% |
| Immigrants | Scotland | 99.8 /100 | #53 | Exceptional 98.3% |
| Bulgarians | 99.8 /100 | #54 | Exceptional 98.3% |
| Americans | 99.8 /100 | #55 | Exceptional 98.3% |
| Austrians | 99.8 /100 | #56 | Exceptional 98.3% |
| Slavs | 99.7 /100 | #57 | Exceptional 98.3% |
| Greeks | 99.7 /100 | #58 | Exceptional 98.3% |
| Maltese | 99.7 /100 | #59 | Exceptional 98.3% |
| Creek | 99.7 /100 | #60 | Exceptional 98.2% |