Taiwanese vs Italian 11th Grade
COMPARE
Taiwanese
Italian
11th Grade
11th Grade Comparison
Taiwanese
Italians
91.3%
11TH GRADE
0.6/ 100
METRIC RATING
261st/ 347
METRIC RANK
94.5%
11TH GRADE
100.0/ 100
METRIC RATING
20th/ 347
METRIC RANK
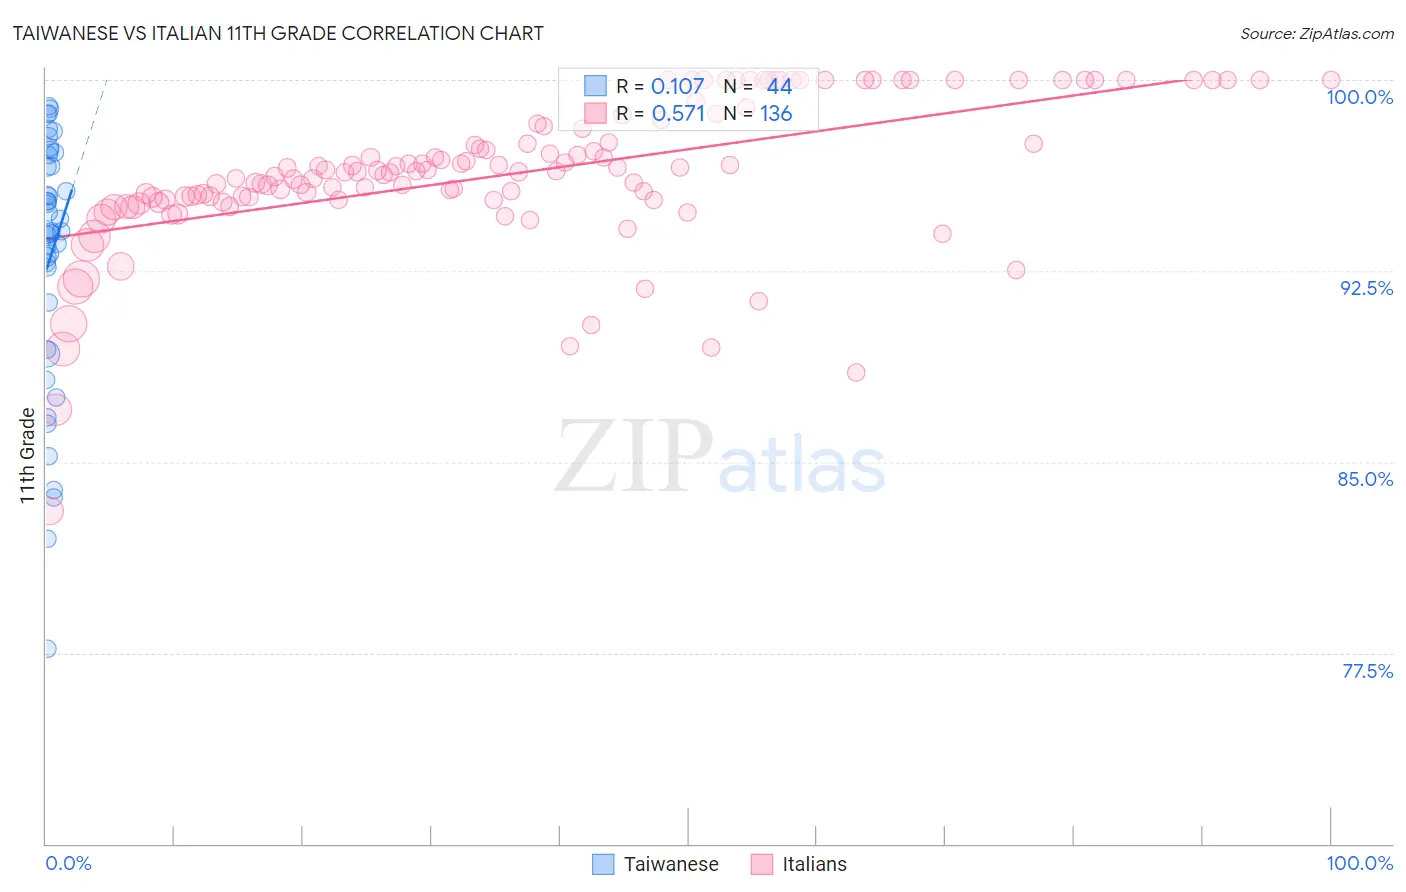
Taiwanese vs Italian 11th Grade Correlation Chart
The statistical analysis conducted on geographies consisting of 31,724,936 people shows a poor positive correlation between the proportion of Taiwanese and percentage of population with at least 11th grade education in the United States with a correlation coefficient (R) of 0.107 and weighted average of 91.3%. Similarly, the statistical analysis conducted on geographies consisting of 575,117,260 people shows a substantial positive correlation between the proportion of Italians and percentage of population with at least 11th grade education in the United States with a correlation coefficient (R) of 0.571 and weighted average of 94.5%, a difference of 3.4%.
11th Grade Correlation Summary
| Measurement | Taiwanese | Italian |
| Minimum | 77.7% | 83.1% |
| Maximum | 98.9% | 100.0% |
| Range | 21.3% | 16.9% |
| Mean | 93.0% | 96.3% |
| Median | 94.0% | 96.4% |
| Interquartile 25% (IQ1) | 90.3% | 95.3% |
| Interquartile 75% (IQ3) | 96.8% | 98.2% |
| Interquartile Range (IQR) | 6.5% | 2.9% |
| Standard Deviation (Sample) | 5.1% | 2.9% |
| Standard Deviation (Population) | 5.0% | 2.9% |
Similar Demographics by 11th Grade
Demographics Similar to Taiwanese by 11th Grade
In terms of 11th grade, the demographic groups most similar to Taiwanese are Jamaican (91.4%, a difference of 0.010%), Spanish American (91.4%, a difference of 0.010%), Immigrants from Uruguay (91.3%, a difference of 0.010%), Immigrants from Colombia (91.4%, a difference of 0.030%), and Immigrants from Senegal (91.4%, a difference of 0.050%).
| Demographics | Rating | Rank | 11th Grade |
| Immigrants | Eritrea | 0.7 /100 | #254 | Tragic 91.4% |
| Blacks/African Americans | 0.7 /100 | #255 | Tragic 91.4% |
| Immigrants | Senegal | 0.7 /100 | #256 | Tragic 91.4% |
| Cajuns | 0.7 /100 | #257 | Tragic 91.4% |
| Immigrants | Colombia | 0.6 /100 | #258 | Tragic 91.4% |
| Jamaicans | 0.6 /100 | #259 | Tragic 91.4% |
| Spanish Americans | 0.6 /100 | #260 | Tragic 91.4% |
| Taiwanese | 0.6 /100 | #261 | Tragic 91.3% |
| Immigrants | Uruguay | 0.5 /100 | #262 | Tragic 91.3% |
| Immigrants | Ghana | 0.3 /100 | #263 | Tragic 91.2% |
| Yup'ik | 0.3 /100 | #264 | Tragic 91.2% |
| Pueblo | 0.3 /100 | #265 | Tragic 91.2% |
| Immigrants | Western Africa | 0.3 /100 | #266 | Tragic 91.2% |
| Immigrants | Jamaica | 0.3 /100 | #267 | Tragic 91.2% |
| U.S. Virgin Islanders | 0.2 /100 | #268 | Tragic 91.1% |
Demographics Similar to Italians by 11th Grade
In terms of 11th grade, the demographic groups most similar to Italians are Tlingit-Haida (94.4%, a difference of 0.010%), Tsimshian (94.4%, a difference of 0.020%), Maltese (94.5%, a difference of 0.030%), Scandinavian (94.5%, a difference of 0.030%), and Czech (94.4%, a difference of 0.030%).
| Demographics | Rating | Rank | 11th Grade |
| Chinese | 100.0 /100 | #13 | Exceptional 94.6% |
| Eastern Europeans | 100.0 /100 | #14 | Exceptional 94.6% |
| Bulgarians | 100.0 /100 | #15 | Exceptional 94.5% |
| Immigrants | India | 100.0 /100 | #16 | Exceptional 94.5% |
| Luxembourgers | 100.0 /100 | #17 | Exceptional 94.5% |
| Maltese | 100.0 /100 | #18 | Exceptional 94.5% |
| Scandinavians | 100.0 /100 | #19 | Exceptional 94.5% |
| Italians | 100.0 /100 | #20 | Exceptional 94.5% |
| Tlingit-Haida | 100.0 /100 | #21 | Exceptional 94.4% |
| Tsimshian | 100.0 /100 | #22 | Exceptional 94.4% |
| Czechs | 100.0 /100 | #23 | Exceptional 94.4% |
| English | 100.0 /100 | #24 | Exceptional 94.4% |
| Irish | 100.0 /100 | #25 | Exceptional 94.4% |
| Scottish | 100.0 /100 | #26 | Exceptional 94.4% |
| Europeans | 100.0 /100 | #27 | Exceptional 94.4% |