Taiwanese vs Bangladeshi 11th Grade
COMPARE
Taiwanese
Bangladeshi
11th Grade
11th Grade Comparison
Taiwanese
Bangladeshis
91.3%
11TH GRADE
0.6/ 100
METRIC RATING
261st/ 347
METRIC RANK
90.9%
11TH GRADE
0.1/ 100
METRIC RATING
276th/ 347
METRIC RANK
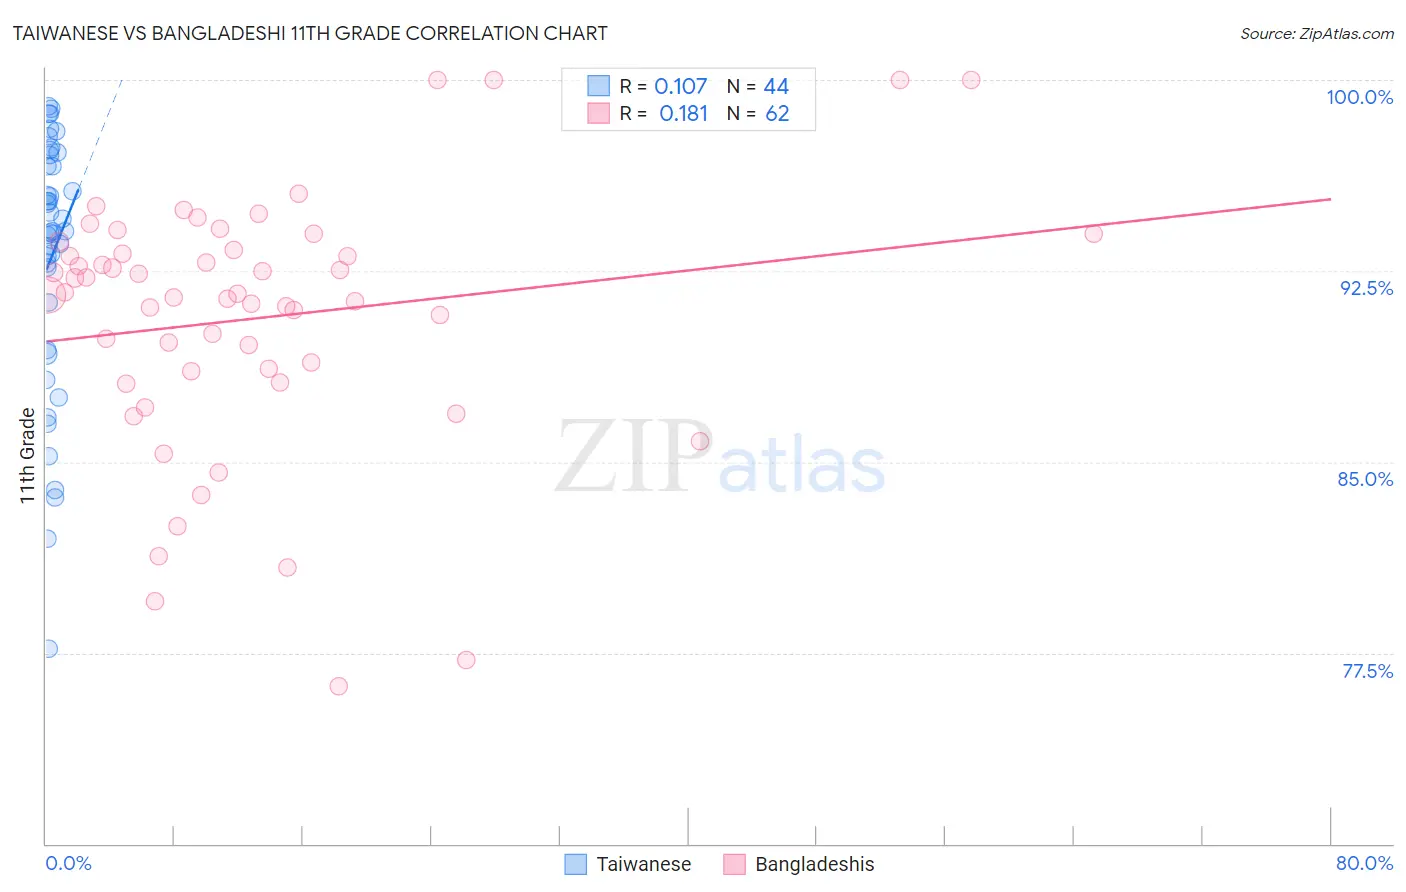
Taiwanese vs Bangladeshi 11th Grade Correlation Chart
The statistical analysis conducted on geographies consisting of 31,724,936 people shows a poor positive correlation between the proportion of Taiwanese and percentage of population with at least 11th grade education in the United States with a correlation coefficient (R) of 0.107 and weighted average of 91.3%. Similarly, the statistical analysis conducted on geographies consisting of 141,450,108 people shows a poor positive correlation between the proportion of Bangladeshis and percentage of population with at least 11th grade education in the United States with a correlation coefficient (R) of 0.181 and weighted average of 90.9%, a difference of 0.53%.
11th Grade Correlation Summary
| Measurement | Taiwanese | Bangladeshi |
| Minimum | 77.7% | 76.2% |
| Maximum | 98.9% | 100.0% |
| Range | 21.3% | 23.8% |
| Mean | 93.0% | 90.6% |
| Median | 94.0% | 91.6% |
| Interquartile 25% (IQ1) | 90.3% | 88.5% |
| Interquartile 75% (IQ3) | 96.8% | 93.3% |
| Interquartile Range (IQR) | 6.5% | 4.8% |
| Standard Deviation (Sample) | 5.1% | 5.0% |
| Standard Deviation (Population) | 5.0% | 5.0% |
Demographics Similar to Taiwanese and Bangladeshis by 11th Grade
In terms of 11th grade, the demographic groups most similar to Taiwanese are Jamaican (91.4%, a difference of 0.010%), Spanish American (91.4%, a difference of 0.010%), Immigrants from Uruguay (91.3%, a difference of 0.010%), Immigrants from Colombia (91.4%, a difference of 0.030%), and Immigrants from Ghana (91.2%, a difference of 0.14%). Similarly, the demographic groups most similar to Bangladeshis are Immigrants from Congo (90.9%, a difference of 0.020%), Malaysian (90.8%, a difference of 0.050%), Immigrants from South Eastern Asia (90.9%, a difference of 0.070%), Immigrants from Trinidad and Tobago (90.9%, a difference of 0.080%), and Paiute (91.0%, a difference of 0.12%).
| Demographics | Rating | Rank | 11th Grade |
| Immigrants | Colombia | 0.6 /100 | #258 | Tragic 91.4% |
| Jamaicans | 0.6 /100 | #259 | Tragic 91.4% |
| Spanish Americans | 0.6 /100 | #260 | Tragic 91.4% |
| Taiwanese | 0.6 /100 | #261 | Tragic 91.3% |
| Immigrants | Uruguay | 0.5 /100 | #262 | Tragic 91.3% |
| Immigrants | Ghana | 0.3 /100 | #263 | Tragic 91.2% |
| Yup'ik | 0.3 /100 | #264 | Tragic 91.2% |
| Pueblo | 0.3 /100 | #265 | Tragic 91.2% |
| Immigrants | Western Africa | 0.3 /100 | #266 | Tragic 91.2% |
| Immigrants | Jamaica | 0.3 /100 | #267 | Tragic 91.2% |
| U.S. Virgin Islanders | 0.2 /100 | #268 | Tragic 91.1% |
| Ute | 0.2 /100 | #269 | Tragic 91.1% |
| Trinidadians and Tobagonians | 0.2 /100 | #270 | Tragic 91.1% |
| Immigrants | Peru | 0.1 /100 | #271 | Tragic 91.0% |
| West Indians | 0.1 /100 | #272 | Tragic 91.0% |
| Paiute | 0.1 /100 | #273 | Tragic 91.0% |
| Immigrants | Trinidad and Tobago | 0.1 /100 | #274 | Tragic 90.9% |
| Immigrants | South Eastern Asia | 0.1 /100 | #275 | Tragic 90.9% |
| Bangladeshis | 0.1 /100 | #276 | Tragic 90.9% |
| Immigrants | Congo | 0.1 /100 | #277 | Tragic 90.9% |
| Malaysians | 0.1 /100 | #278 | Tragic 90.8% |