Taiwanese vs Immigrants from Costa Rica 11th Grade
COMPARE
Taiwanese
Immigrants from Costa Rica
11th Grade
11th Grade Comparison
Taiwanese
Immigrants from Costa Rica
91.3%
11TH GRADE
0.6/ 100
METRIC RATING
261st/ 347
METRIC RANK
91.4%
11TH GRADE
0.9/ 100
METRIC RATING
251st/ 347
METRIC RANK
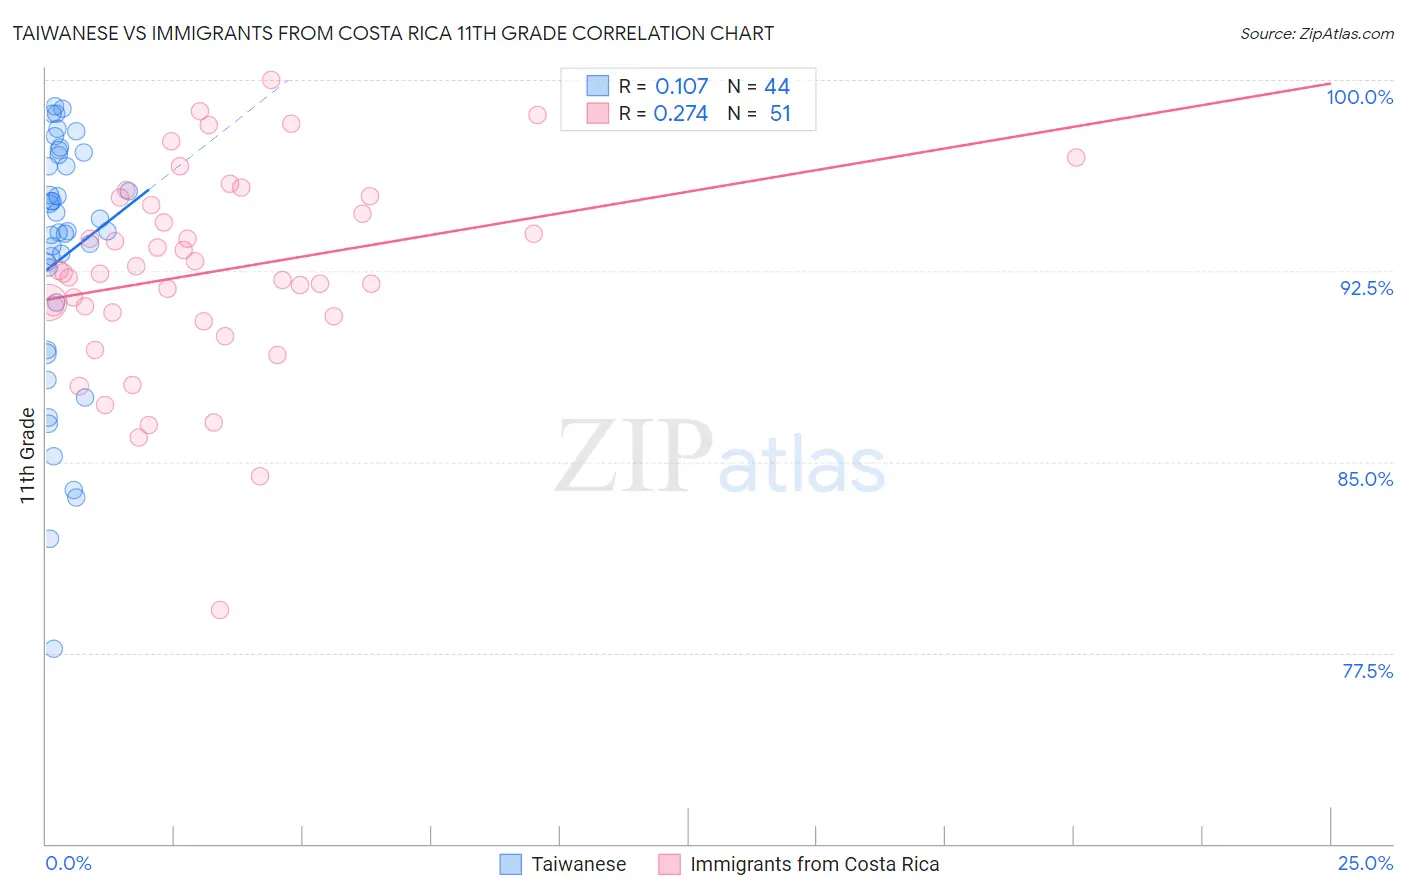
Taiwanese vs Immigrants from Costa Rica 11th Grade Correlation Chart
The statistical analysis conducted on geographies consisting of 31,724,936 people shows a poor positive correlation between the proportion of Taiwanese and percentage of population with at least 11th grade education in the United States with a correlation coefficient (R) of 0.107 and weighted average of 91.3%. Similarly, the statistical analysis conducted on geographies consisting of 204,277,241 people shows a weak positive correlation between the proportion of Immigrants from Costa Rica and percentage of population with at least 11th grade education in the United States with a correlation coefficient (R) of 0.274 and weighted average of 91.4%, a difference of 0.10%.
11th Grade Correlation Summary
| Measurement | Taiwanese | Immigrants from Costa Rica |
| Minimum | 77.7% | 79.2% |
| Maximum | 98.9% | 100.0% |
| Range | 21.3% | 20.8% |
| Mean | 93.0% | 92.5% |
| Median | 94.0% | 92.4% |
| Interquartile 25% (IQ1) | 90.3% | 90.7% |
| Interquartile 75% (IQ3) | 96.8% | 95.4% |
| Interquartile Range (IQR) | 6.5% | 4.7% |
| Standard Deviation (Sample) | 5.1% | 4.0% |
| Standard Deviation (Population) | 5.0% | 4.0% |
Demographics Similar to Taiwanese and Immigrants from Costa Rica by 11th Grade
In terms of 11th grade, the demographic groups most similar to Taiwanese are Jamaican (91.4%, a difference of 0.010%), Spanish American (91.4%, a difference of 0.010%), Immigrants from Uruguay (91.3%, a difference of 0.010%), Immigrants from Colombia (91.4%, a difference of 0.030%), and Immigrants from Senegal (91.4%, a difference of 0.050%). Similarly, the demographic groups most similar to Immigrants from Costa Rica are Immigrants from Nigeria (91.4%, a difference of 0.010%), Peruvian (91.5%, a difference of 0.020%), Ghanaian (91.5%, a difference of 0.020%), Immigrants from South America (91.4%, a difference of 0.020%), and Immigrants from Philippines (91.5%, a difference of 0.030%).
| Demographics | Rating | Rank | 11th Grade |
| Seminole | 1.2 /100 | #246 | Tragic 91.5% |
| Immigrants | Philippines | 1.0 /100 | #247 | Tragic 91.5% |
| Immigrants | Uzbekistan | 1.0 /100 | #248 | Tragic 91.5% |
| Peruvians | 1.0 /100 | #249 | Tragic 91.5% |
| Ghanaians | 0.9 /100 | #250 | Tragic 91.5% |
| Immigrants | Costa Rica | 0.9 /100 | #251 | Tragic 91.4% |
| Immigrants | Nigeria | 0.8 /100 | #252 | Tragic 91.4% |
| Immigrants | South America | 0.8 /100 | #253 | Tragic 91.4% |
| Immigrants | Eritrea | 0.7 /100 | #254 | Tragic 91.4% |
| Blacks/African Americans | 0.7 /100 | #255 | Tragic 91.4% |
| Immigrants | Senegal | 0.7 /100 | #256 | Tragic 91.4% |
| Cajuns | 0.7 /100 | #257 | Tragic 91.4% |
| Immigrants | Colombia | 0.6 /100 | #258 | Tragic 91.4% |
| Jamaicans | 0.6 /100 | #259 | Tragic 91.4% |
| Spanish Americans | 0.6 /100 | #260 | Tragic 91.4% |
| Taiwanese | 0.6 /100 | #261 | Tragic 91.3% |
| Immigrants | Uruguay | 0.5 /100 | #262 | Tragic 91.3% |
| Immigrants | Ghana | 0.3 /100 | #263 | Tragic 91.2% |
| Yup'ik | 0.3 /100 | #264 | Tragic 91.2% |
| Pueblo | 0.3 /100 | #265 | Tragic 91.2% |
| Immigrants | Western Africa | 0.3 /100 | #266 | Tragic 91.2% |