Immigrants from Brazil vs Immigrants from Kuwait GED/Equivalency
COMPARE
Immigrants from Brazil
Immigrants from Kuwait
GED/Equivalency
GED/Equivalency Comparison
Immigrants from Brazil
Immigrants from Kuwait
86.6%
GED/EQUIVALENCY
88.4/ 100
METRIC RATING
132nd/ 347
METRIC RANK
87.7%
GED/EQUIVALENCY
98.8/ 100
METRIC RATING
74th/ 347
METRIC RANK
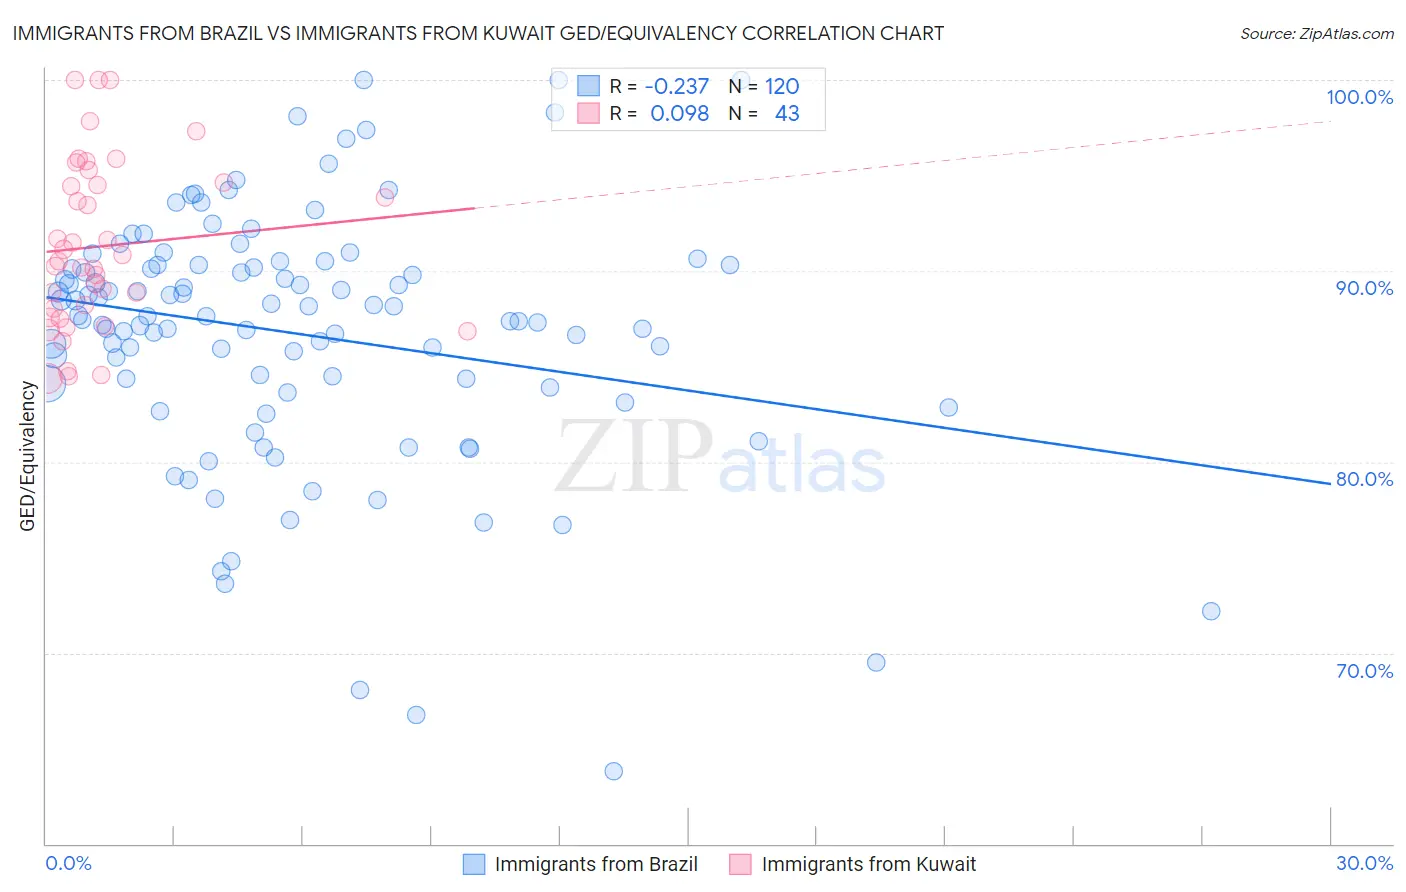
Immigrants from Brazil vs Immigrants from Kuwait GED/Equivalency Correlation Chart
The statistical analysis conducted on geographies consisting of 343,008,543 people shows a weak negative correlation between the proportion of Immigrants from Brazil and percentage of population with at least ged/equivalency education in the United States with a correlation coefficient (R) of -0.237 and weighted average of 86.6%. Similarly, the statistical analysis conducted on geographies consisting of 136,917,085 people shows a slight positive correlation between the proportion of Immigrants from Kuwait and percentage of population with at least ged/equivalency education in the United States with a correlation coefficient (R) of 0.098 and weighted average of 87.7%, a difference of 1.2%.
GED/Equivalency Correlation Summary
| Measurement | Immigrants from Brazil | Immigrants from Kuwait |
| Minimum | 63.8% | 84.4% |
| Maximum | 100.0% | 100.0% |
| Range | 36.2% | 15.6% |
| Mean | 86.7% | 91.3% |
| Median | 87.6% | 90.5% |
| Interquartile 25% (IQ1) | 84.0% | 87.6% |
| Interquartile 75% (IQ3) | 90.3% | 94.6% |
| Interquartile Range (IQR) | 6.3% | 7.0% |
| Standard Deviation (Sample) | 6.6% | 4.4% |
| Standard Deviation (Population) | 6.6% | 4.3% |
Similar Demographics by GED/Equivalency
Demographics Similar to Immigrants from Brazil by GED/Equivalency
In terms of ged/equivalency, the demographic groups most similar to Immigrants from Brazil are Immigrants from Spain (86.7%, a difference of 0.0%), Tsimshian (86.6%, a difference of 0.0%), Immigrants from Germany (86.7%, a difference of 0.020%), Immigrants from Ukraine (86.7%, a difference of 0.030%), and Albanian (86.6%, a difference of 0.030%).
| Demographics | Rating | Rank | GED/Equivalency |
| Celtics | 90.4 /100 | #125 | Exceptional 86.7% |
| Asians | 90.3 /100 | #126 | Exceptional 86.7% |
| Argentineans | 89.7 /100 | #127 | Excellent 86.7% |
| Yugoslavians | 89.5 /100 | #128 | Excellent 86.7% |
| Immigrants | Ukraine | 88.9 /100 | #129 | Excellent 86.7% |
| Immigrants | Germany | 88.8 /100 | #130 | Excellent 86.7% |
| Immigrants | Spain | 88.5 /100 | #131 | Excellent 86.7% |
| Immigrants | Brazil | 88.4 /100 | #132 | Excellent 86.6% |
| Tsimshian | 88.3 /100 | #133 | Excellent 86.6% |
| Albanians | 87.7 /100 | #134 | Excellent 86.6% |
| Immigrants | Asia | 87.4 /100 | #135 | Excellent 86.6% |
| Chileans | 86.9 /100 | #136 | Excellent 86.6% |
| Arabs | 86.7 /100 | #137 | Excellent 86.6% |
| Immigrants | Argentina | 86.5 /100 | #138 | Excellent 86.6% |
| Immigrants | Malaysia | 85.0 /100 | #139 | Excellent 86.5% |
Demographics Similar to Immigrants from Kuwait by GED/Equivalency
In terms of ged/equivalency, the demographic groups most similar to Immigrants from Kuwait are Belgian (87.7%, a difference of 0.020%), Scottish (87.7%, a difference of 0.020%), Ukrainian (87.7%, a difference of 0.030%), Austrian (87.7%, a difference of 0.030%), and Immigrants from Moldova (87.7%, a difference of 0.030%).
| Demographics | Rating | Rank | GED/Equivalency |
| British | 99.1 /100 | #67 | Exceptional 87.8% |
| Immigrants | France | 99.1 /100 | #68 | Exceptional 87.8% |
| Immigrants | Saudi Arabia | 99.0 /100 | #69 | Exceptional 87.8% |
| Ukrainians | 98.8 /100 | #70 | Exceptional 87.7% |
| Austrians | 98.8 /100 | #71 | Exceptional 87.7% |
| Immigrants | Moldova | 98.8 /100 | #72 | Exceptional 87.7% |
| Belgians | 98.8 /100 | #73 | Exceptional 87.7% |
| Immigrants | Kuwait | 98.8 /100 | #74 | Exceptional 87.7% |
| Scottish | 98.7 /100 | #75 | Exceptional 87.7% |
| Immigrants | Serbia | 98.7 /100 | #76 | Exceptional 87.7% |
| Slavs | 98.7 /100 | #77 | Exceptional 87.7% |
| Irish | 98.6 /100 | #78 | Exceptional 87.6% |
| English | 98.6 /100 | #79 | Exceptional 87.6% |
| Immigrants | England | 98.5 /100 | #80 | Exceptional 87.6% |
| Immigrants | Sri Lanka | 98.3 /100 | #81 | Exceptional 87.5% |