Immigrants from South Central Asia vs Immigrants from Kuwait GED/Equivalency
COMPARE
Immigrants from South Central Asia
Immigrants from Kuwait
GED/Equivalency
GED/Equivalency Comparison
Immigrants from South Central Asia
Immigrants from Kuwait
88.4%
GED/EQUIVALENCY
99.7/ 100
METRIC RATING
35th/ 347
METRIC RANK
87.7%
GED/EQUIVALENCY
98.8/ 100
METRIC RATING
74th/ 347
METRIC RANK
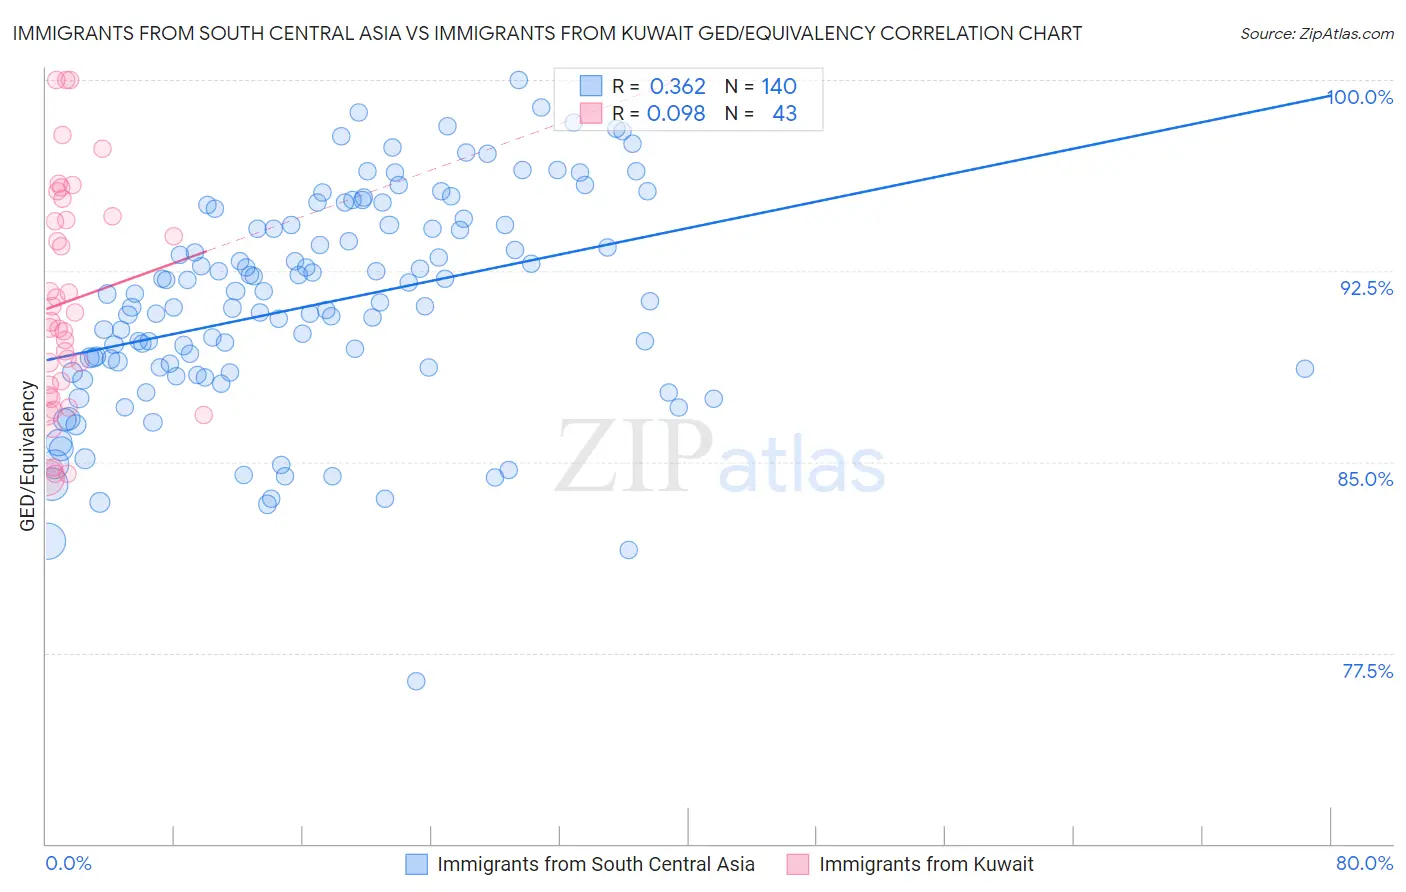
Immigrants from South Central Asia vs Immigrants from Kuwait GED/Equivalency Correlation Chart
The statistical analysis conducted on geographies consisting of 473,113,181 people shows a mild positive correlation between the proportion of Immigrants from South Central Asia and percentage of population with at least ged/equivalency education in the United States with a correlation coefficient (R) of 0.362 and weighted average of 88.4%. Similarly, the statistical analysis conducted on geographies consisting of 136,917,085 people shows a slight positive correlation between the proportion of Immigrants from Kuwait and percentage of population with at least ged/equivalency education in the United States with a correlation coefficient (R) of 0.098 and weighted average of 87.7%, a difference of 0.78%.
GED/Equivalency Correlation Summary
| Measurement | Immigrants from South Central Asia | Immigrants from Kuwait |
| Minimum | 76.4% | 84.4% |
| Maximum | 100.0% | 100.0% |
| Range | 23.6% | 15.6% |
| Mean | 91.2% | 91.3% |
| Median | 91.3% | 90.5% |
| Interquartile 25% (IQ1) | 88.6% | 87.6% |
| Interquartile 75% (IQ3) | 94.3% | 94.6% |
| Interquartile Range (IQR) | 5.7% | 7.0% |
| Standard Deviation (Sample) | 4.3% | 4.4% |
| Standard Deviation (Population) | 4.2% | 4.3% |
Similar Demographics by GED/Equivalency
Demographics Similar to Immigrants from South Central Asia by GED/Equivalency
In terms of ged/equivalency, the demographic groups most similar to Immigrants from South Central Asia are Immigrants from Sweden (88.4%, a difference of 0.020%), Immigrants from Japan (88.4%, a difference of 0.020%), Immigrants from Belgium (88.3%, a difference of 0.020%), Immigrants from Austria (88.3%, a difference of 0.050%), and Danish (88.4%, a difference of 0.060%).
| Demographics | Rating | Rank | GED/Equivalency |
| Immigrants | Northern Europe | 99.8 /100 | #28 | Exceptional 88.5% |
| Poles | 99.8 /100 | #29 | Exceptional 88.5% |
| Turks | 99.8 /100 | #30 | Exceptional 88.5% |
| Bhutanese | 99.8 /100 | #31 | Exceptional 88.4% |
| Danes | 99.8 /100 | #32 | Exceptional 88.4% |
| Immigrants | Sweden | 99.7 /100 | #33 | Exceptional 88.4% |
| Immigrants | Japan | 99.7 /100 | #34 | Exceptional 88.4% |
| Immigrants | South Central Asia | 99.7 /100 | #35 | Exceptional 88.4% |
| Immigrants | Belgium | 99.7 /100 | #36 | Exceptional 88.3% |
| Immigrants | Austria | 99.7 /100 | #37 | Exceptional 88.3% |
| Burmese | 99.7 /100 | #38 | Exceptional 88.3% |
| Immigrants | Israel | 99.6 /100 | #39 | Exceptional 88.2% |
| Italians | 99.6 /100 | #40 | Exceptional 88.2% |
| Finns | 99.6 /100 | #41 | Exceptional 88.2% |
| Cambodians | 99.6 /100 | #42 | Exceptional 88.2% |
Demographics Similar to Immigrants from Kuwait by GED/Equivalency
In terms of ged/equivalency, the demographic groups most similar to Immigrants from Kuwait are Belgian (87.7%, a difference of 0.020%), Scottish (87.7%, a difference of 0.020%), Ukrainian (87.7%, a difference of 0.030%), Austrian (87.7%, a difference of 0.030%), and Immigrants from Moldova (87.7%, a difference of 0.030%).
| Demographics | Rating | Rank | GED/Equivalency |
| British | 99.1 /100 | #67 | Exceptional 87.8% |
| Immigrants | France | 99.1 /100 | #68 | Exceptional 87.8% |
| Immigrants | Saudi Arabia | 99.0 /100 | #69 | Exceptional 87.8% |
| Ukrainians | 98.8 /100 | #70 | Exceptional 87.7% |
| Austrians | 98.8 /100 | #71 | Exceptional 87.7% |
| Immigrants | Moldova | 98.8 /100 | #72 | Exceptional 87.7% |
| Belgians | 98.8 /100 | #73 | Exceptional 87.7% |
| Immigrants | Kuwait | 98.8 /100 | #74 | Exceptional 87.7% |
| Scottish | 98.7 /100 | #75 | Exceptional 87.7% |
| Immigrants | Serbia | 98.7 /100 | #76 | Exceptional 87.7% |
| Slavs | 98.7 /100 | #77 | Exceptional 87.7% |
| Irish | 98.6 /100 | #78 | Exceptional 87.6% |
| English | 98.6 /100 | #79 | Exceptional 87.6% |
| Immigrants | England | 98.5 /100 | #80 | Exceptional 87.6% |
| Immigrants | Sri Lanka | 98.3 /100 | #81 | Exceptional 87.5% |