Syrian vs Subsaharan African College, 1 year or more
COMPARE
Syrian
Subsaharan African
College, 1 year or more
College, 1 year or more Comparison
Syrians
Sub-Saharan Africans
61.9%
COLLEGE, 1 YEAR OR MORE
95.7/ 100
METRIC RATING
108th/ 347
METRIC RANK
57.3%
COLLEGE, 1 YEAR OR MORE
6.1/ 100
METRIC RATING
222nd/ 347
METRIC RANK
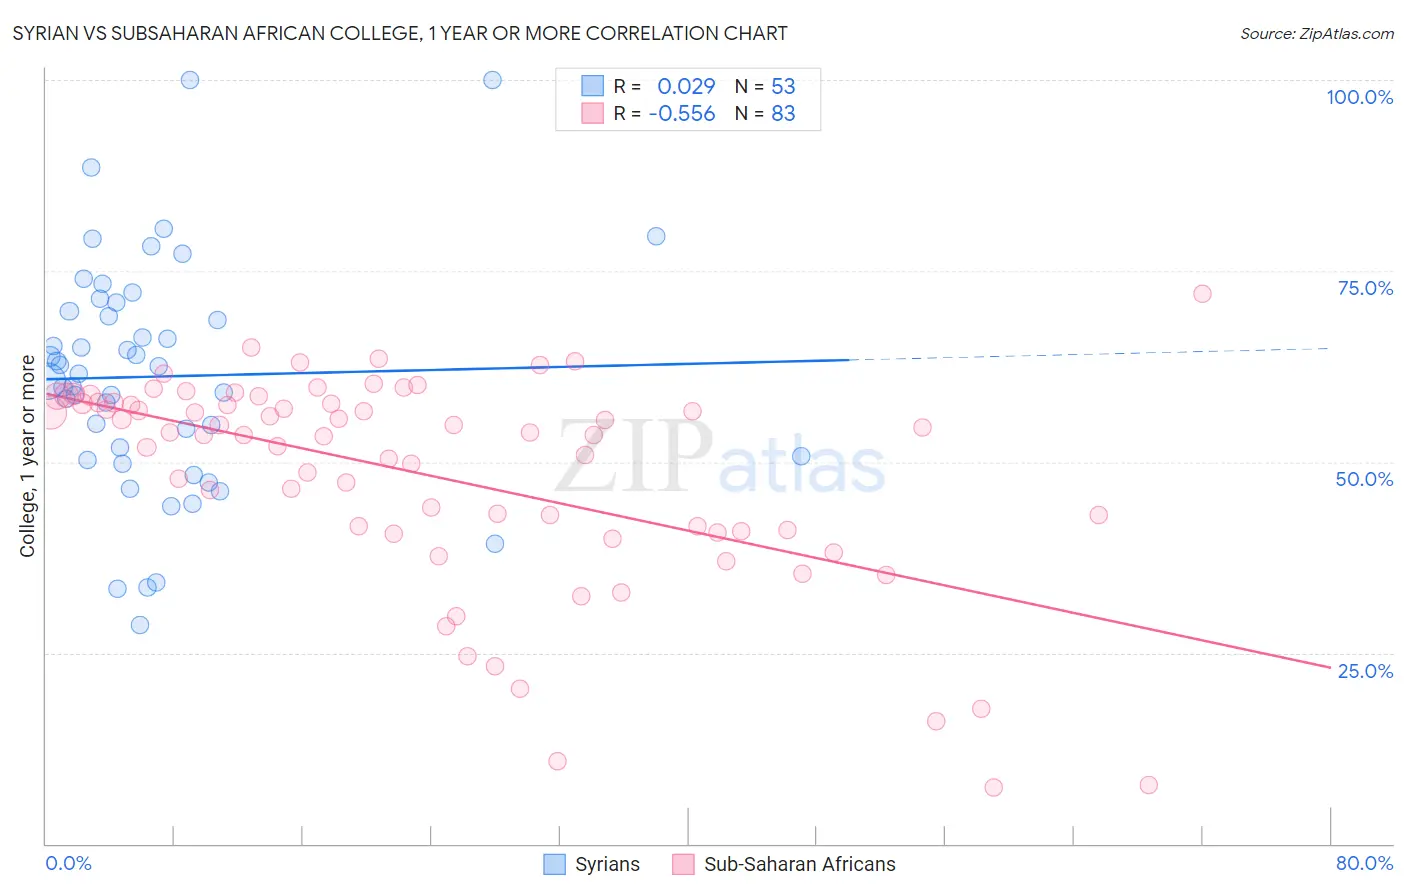
Syrian vs Subsaharan African College, 1 year or more Correlation Chart
The statistical analysis conducted on geographies consisting of 266,306,496 people shows no correlation between the proportion of Syrians and percentage of population with at least college, 1 year or more education in the United States with a correlation coefficient (R) of 0.029 and weighted average of 61.9%. Similarly, the statistical analysis conducted on geographies consisting of 508,212,148 people shows a substantial negative correlation between the proportion of Sub-Saharan Africans and percentage of population with at least college, 1 year or more education in the United States with a correlation coefficient (R) of -0.556 and weighted average of 57.3%, a difference of 8.1%.
College, 1 year or more Correlation Summary
| Measurement | Syrian | Subsaharan African |
| Minimum | 28.6% | 7.4% |
| Maximum | 100.0% | 72.0% |
| Range | 71.4% | 64.6% |
| Mean | 61.2% | 48.2% |
| Median | 61.5% | 53.5% |
| Interquartile 25% (IQ1) | 50.5% | 40.9% |
| Interquartile 75% (IQ3) | 70.2% | 57.8% |
| Interquartile Range (IQR) | 19.7% | 16.8% |
| Standard Deviation (Sample) | 15.2% | 14.0% |
| Standard Deviation (Population) | 15.1% | 13.9% |
Similar Demographics by College, 1 year or more
Demographics Similar to Syrians by College, 1 year or more
In terms of college, 1 year or more, the demographic groups most similar to Syrians are Immigrants from Northern Africa (61.9%, a difference of 0.0%), Immigrants from Ukraine (61.9%, a difference of 0.020%), European (61.8%, a difference of 0.020%), Macedonian (61.8%, a difference of 0.020%), and Austrian (61.8%, a difference of 0.080%).
| Demographics | Rating | Rank | College, 1 year or more |
| Swedes | 96.8 /100 | #101 | Exceptional 62.1% |
| Luxembourgers | 96.7 /100 | #102 | Exceptional 62.1% |
| Afghans | 96.4 /100 | #103 | Exceptional 62.0% |
| Chileans | 96.4 /100 | #104 | Exceptional 62.0% |
| Immigrants | Nepal | 96.3 /100 | #105 | Exceptional 62.0% |
| Palestinians | 96.3 /100 | #106 | Exceptional 62.0% |
| Immigrants | Ukraine | 95.8 /100 | #107 | Exceptional 61.9% |
| Syrians | 95.7 /100 | #108 | Exceptional 61.9% |
| Immigrants | Northern Africa | 95.7 /100 | #109 | Exceptional 61.9% |
| Europeans | 95.6 /100 | #110 | Exceptional 61.8% |
| Macedonians | 95.6 /100 | #111 | Exceptional 61.8% |
| Austrians | 95.4 /100 | #112 | Exceptional 61.8% |
| Ukrainians | 95.2 /100 | #113 | Exceptional 61.8% |
| Danes | 94.8 /100 | #114 | Exceptional 61.7% |
| Norwegians | 94.5 /100 | #115 | Exceptional 61.7% |
Demographics Similar to Sub-Saharan Africans by College, 1 year or more
In terms of college, 1 year or more, the demographic groups most similar to Sub-Saharan Africans are Portuguese (57.2%, a difference of 0.17%), Hmong (57.2%, a difference of 0.17%), Immigrants from Ghana (57.4%, a difference of 0.34%), Vietnamese (57.0%, a difference of 0.38%), and Immigrants from Western Africa (57.0%, a difference of 0.40%).
| Demographics | Rating | Rank | College, 1 year or more |
| Tongans | 11.6 /100 | #215 | Poor 57.8% |
| Immigrants | Peru | 10.6 /100 | #216 | Poor 57.7% |
| Immigrants | Panama | 9.1 /100 | #217 | Tragic 57.6% |
| Native Hawaiians | 9.0 /100 | #218 | Tragic 57.6% |
| Whites/Caucasians | 8.7 /100 | #219 | Tragic 57.6% |
| Immigrants | Costa Rica | 8.0 /100 | #220 | Tragic 57.5% |
| Immigrants | Ghana | 7.7 /100 | #221 | Tragic 57.4% |
| Sub-Saharan Africans | 6.1 /100 | #222 | Tragic 57.3% |
| Portuguese | 5.4 /100 | #223 | Tragic 57.2% |
| Hmong | 5.4 /100 | #224 | Tragic 57.2% |
| Vietnamese | 4.7 /100 | #225 | Tragic 57.0% |
| Immigrants | Western Africa | 4.6 /100 | #226 | Tragic 57.0% |
| Immigrants | Immigrants | 4.4 /100 | #227 | Tragic 57.0% |
| Immigrants | Fiji | 4.0 /100 | #228 | Tragic 56.9% |
| Cree | 3.6 /100 | #229 | Tragic 56.8% |