Syrian vs Belgian College, Under 1 year
COMPARE
Syrian
Belgian
College, Under 1 year
College, Under 1 year Comparison
Syrians
Belgians
67.6%
COLLEGE, UNDER 1 YEAR
95.6/ 100
METRIC RATING
113th/ 347
METRIC RANK
66.2%
COLLEGE, UNDER 1 YEAR
73.7/ 100
METRIC RATING
153rd/ 347
METRIC RANK
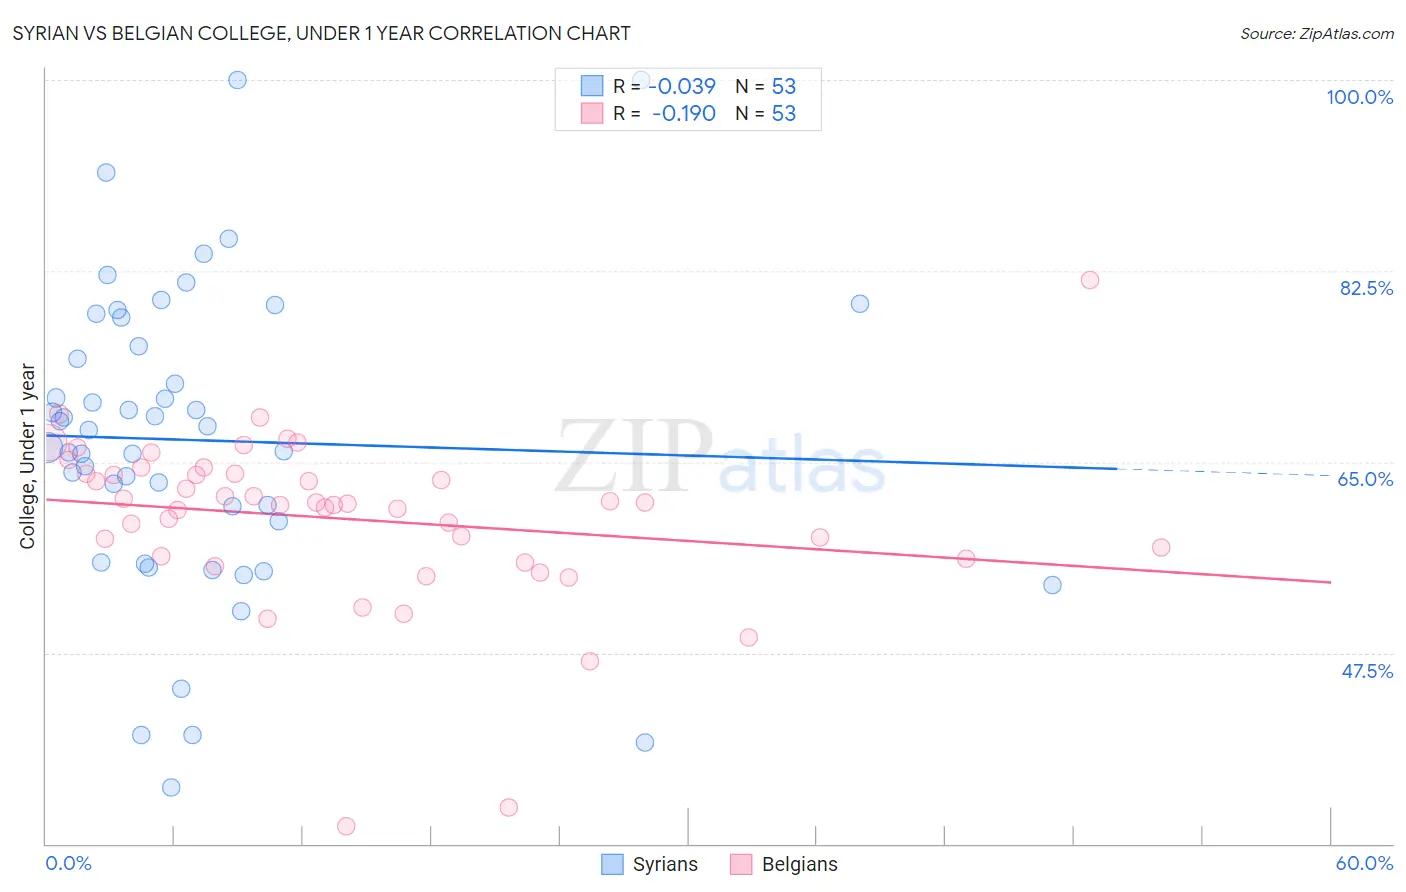
Syrian vs Belgian College, Under 1 year Correlation Chart
The statistical analysis conducted on geographies consisting of 266,306,496 people shows no correlation between the proportion of Syrians and percentage of population with at least college, under 1 year education in the United States with a correlation coefficient (R) of -0.039 and weighted average of 67.6%. Similarly, the statistical analysis conducted on geographies consisting of 356,017,450 people shows a poor negative correlation between the proportion of Belgians and percentage of population with at least college, under 1 year education in the United States with a correlation coefficient (R) of -0.190 and weighted average of 66.2%, a difference of 2.2%.
College, Under 1 year Correlation Summary
| Measurement | Syrian | Belgian |
| Minimum | 35.1% | 31.6% |
| Maximum | 100.0% | 81.6% |
| Range | 64.9% | 50.1% |
| Mean | 67.0% | 59.8% |
| Median | 68.0% | 61.1% |
| Interquartile 25% (IQ1) | 57.7% | 56.3% |
| Interquartile 75% (IQ3) | 76.9% | 63.9% |
| Interquartile Range (IQR) | 19.2% | 7.6% |
| Standard Deviation (Sample) | 14.0% | 8.0% |
| Standard Deviation (Population) | 13.9% | 7.9% |
Similar Demographics by College, Under 1 year
Demographics Similar to Syrians by College, Under 1 year
In terms of college, under 1 year, the demographic groups most similar to Syrians are Macedonian (67.6%, a difference of 0.030%), Assyrian/Chaldean/Syriac (67.7%, a difference of 0.040%), Ukrainian (67.7%, a difference of 0.040%), Scandinavian (67.7%, a difference of 0.050%), and Chilean (67.6%, a difference of 0.080%).
| Demographics | Rating | Rank | College, Under 1 year |
| Immigrants | Croatia | 96.6 /100 | #106 | Exceptional 67.8% |
| Austrians | 96.4 /100 | #107 | Exceptional 67.8% |
| Immigrants | Egypt | 96.0 /100 | #108 | Exceptional 67.7% |
| Scandinavians | 95.8 /100 | #109 | Exceptional 67.7% |
| Assyrians/Chaldeans/Syriacs | 95.8 /100 | #110 | Exceptional 67.7% |
| Ukrainians | 95.8 /100 | #111 | Exceptional 67.7% |
| Macedonians | 95.7 /100 | #112 | Exceptional 67.6% |
| Syrians | 95.6 /100 | #113 | Exceptional 67.6% |
| Chileans | 95.3 /100 | #114 | Exceptional 67.6% |
| Basques | 95.2 /100 | #115 | Exceptional 67.6% |
| Immigrants | Nepal | 94.9 /100 | #116 | Exceptional 67.5% |
| Pakistanis | 94.8 /100 | #117 | Exceptional 67.5% |
| Immigrants | Ukraine | 94.7 /100 | #118 | Exceptional 67.5% |
| Lebanese | 94.6 /100 | #119 | Exceptional 67.5% |
| Serbians | 93.9 /100 | #120 | Exceptional 67.4% |
Demographics Similar to Belgians by College, Under 1 year
In terms of college, under 1 year, the demographic groups most similar to Belgians are Sudanese (66.2%, a difference of 0.020%), Immigrants from Eritrea (66.1%, a difference of 0.10%), Immigrants from Sudan (66.2%, a difference of 0.13%), Irish (66.0%, a difference of 0.18%), and Immigrants from Iraq (66.3%, a difference of 0.20%).
| Demographics | Rating | Rank | College, Under 1 year |
| Kenyans | 81.7 /100 | #146 | Excellent 66.5% |
| Immigrants | Morocco | 81.7 /100 | #147 | Excellent 66.5% |
| Taiwanese | 78.6 /100 | #148 | Good 66.4% |
| Immigrants | Venezuela | 77.9 /100 | #149 | Good 66.3% |
| Immigrants | Iraq | 77.1 /100 | #150 | Good 66.3% |
| Immigrants | Sudan | 76.0 /100 | #151 | Good 66.2% |
| Sudanese | 74.1 /100 | #152 | Good 66.2% |
| Belgians | 73.7 /100 | #153 | Good 66.2% |
| Immigrants | Eritrea | 71.9 /100 | #154 | Good 66.1% |
| Irish | 70.3 /100 | #155 | Good 66.0% |
| Welsh | 69.9 /100 | #156 | Good 66.0% |
| Sierra Leoneans | 67.8 /100 | #157 | Good 66.0% |
| Celtics | 67.3 /100 | #158 | Good 65.9% |
| Tlingit-Haida | 66.4 /100 | #159 | Good 65.9% |
| Albanians | 66.1 /100 | #160 | Good 65.9% |