Houma vs Belgian College, Under 1 year
COMPARE
Houma
Belgian
College, Under 1 year
College, Under 1 year Comparison
Houma
Belgians
47.6%
COLLEGE, UNDER 1 YEAR
0.0/ 100
METRIC RATING
346th/ 347
METRIC RANK
66.2%
COLLEGE, UNDER 1 YEAR
73.7/ 100
METRIC RATING
153rd/ 347
METRIC RANK
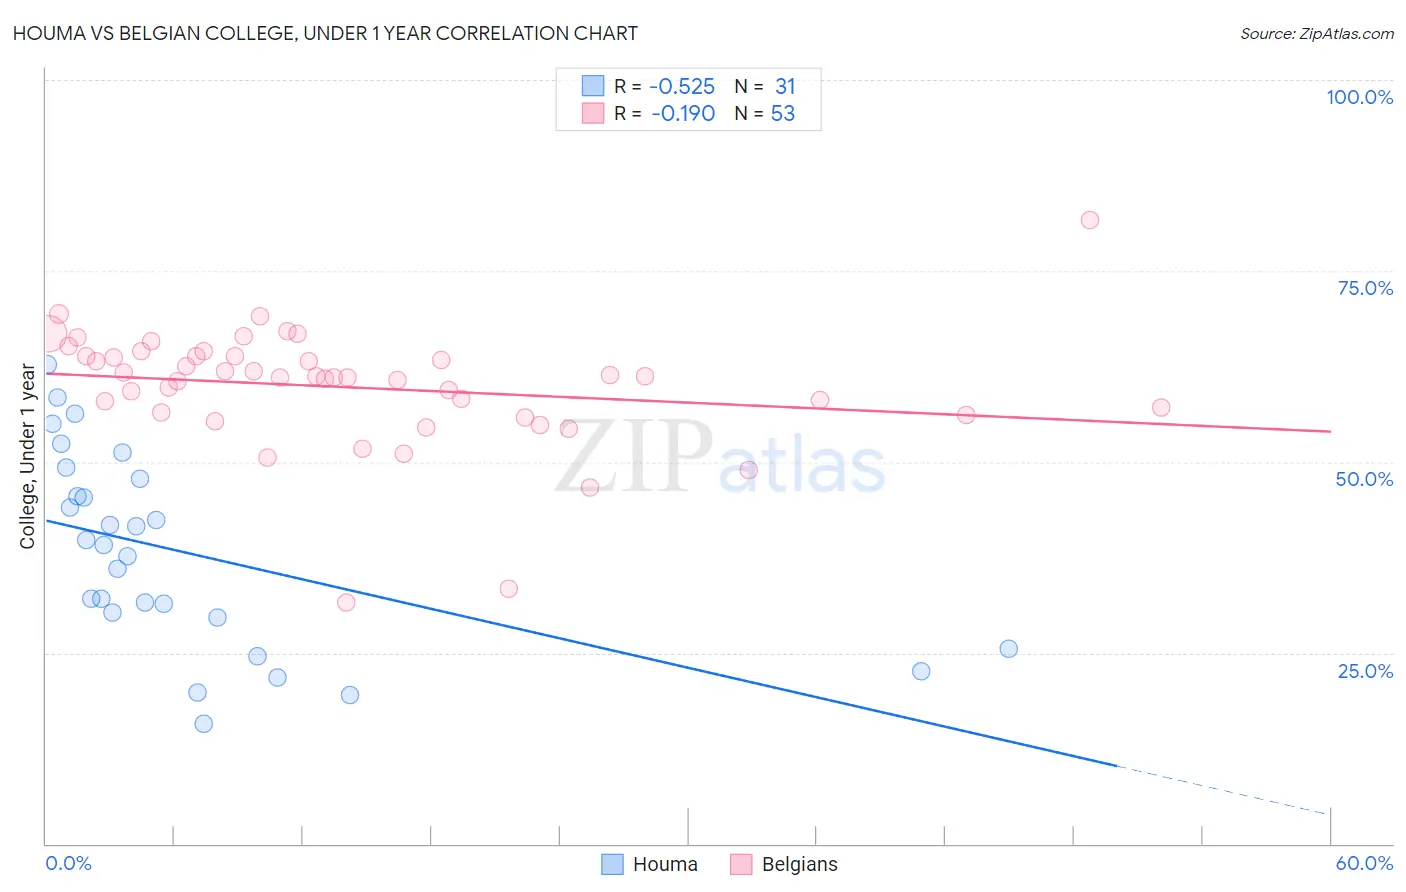
Houma vs Belgian College, Under 1 year Correlation Chart
The statistical analysis conducted on geographies consisting of 36,795,916 people shows a substantial negative correlation between the proportion of Houma and percentage of population with at least college, under 1 year education in the United States with a correlation coefficient (R) of -0.525 and weighted average of 47.6%. Similarly, the statistical analysis conducted on geographies consisting of 356,017,450 people shows a poor negative correlation between the proportion of Belgians and percentage of population with at least college, under 1 year education in the United States with a correlation coefficient (R) of -0.190 and weighted average of 66.2%, a difference of 38.9%.
College, Under 1 year Correlation Summary
| Measurement | Houma | Belgian |
| Minimum | 15.6% | 31.6% |
| Maximum | 62.7% | 81.6% |
| Range | 47.1% | 50.1% |
| Mean | 38.1% | 59.8% |
| Median | 39.1% | 61.1% |
| Interquartile 25% (IQ1) | 29.7% | 56.3% |
| Interquartile 75% (IQ3) | 47.7% | 63.9% |
| Interquartile Range (IQR) | 18.1% | 7.6% |
| Standard Deviation (Sample) | 12.6% | 8.0% |
| Standard Deviation (Population) | 12.4% | 7.9% |
Similar Demographics by College, Under 1 year
Demographics Similar to Houma by College, Under 1 year
In terms of college, under 1 year, the demographic groups most similar to Houma are Yup'ik (45.8%, a difference of 4.1%), Pima (51.4%, a difference of 7.9%), Yakama (52.6%, a difference of 10.5%), Tohono O'odham (52.8%, a difference of 10.8%), and Immigrants from Mexico (53.7%, a difference of 12.6%).
| Demographics | Rating | Rank | College, Under 1 year |
| Yuman | 0.0 /100 | #333 | Tragic 55.1% |
| Immigrants | Azores | 0.0 /100 | #334 | Tragic 54.7% |
| Inupiat | 0.0 /100 | #335 | Tragic 54.6% |
| Pennsylvania Germans | 0.0 /100 | #336 | Tragic 54.5% |
| Immigrants | Central America | 0.0 /100 | #337 | Tragic 54.4% |
| Lumbee | 0.0 /100 | #338 | Tragic 54.2% |
| Immigrants | Dominican Republic | 0.0 /100 | #339 | Tragic 54.0% |
| Spanish American Indians | 0.0 /100 | #340 | Tragic 54.0% |
| Immigrants | Cabo Verde | 0.0 /100 | #341 | Tragic 53.7% |
| Immigrants | Mexico | 0.0 /100 | #342 | Tragic 53.7% |
| Tohono O'odham | 0.0 /100 | #343 | Tragic 52.8% |
| Yakama | 0.0 /100 | #344 | Tragic 52.6% |
| Pima | 0.0 /100 | #345 | Tragic 51.4% |
| Houma | 0.0 /100 | #346 | Tragic 47.6% |
| Yup'ik | 0.0 /100 | #347 | Tragic 45.8% |
Demographics Similar to Belgians by College, Under 1 year
In terms of college, under 1 year, the demographic groups most similar to Belgians are Sudanese (66.2%, a difference of 0.020%), Immigrants from Eritrea (66.1%, a difference of 0.10%), Immigrants from Sudan (66.2%, a difference of 0.13%), Irish (66.0%, a difference of 0.18%), and Immigrants from Iraq (66.3%, a difference of 0.20%).
| Demographics | Rating | Rank | College, Under 1 year |
| Kenyans | 81.7 /100 | #146 | Excellent 66.5% |
| Immigrants | Morocco | 81.7 /100 | #147 | Excellent 66.5% |
| Taiwanese | 78.6 /100 | #148 | Good 66.4% |
| Immigrants | Venezuela | 77.9 /100 | #149 | Good 66.3% |
| Immigrants | Iraq | 77.1 /100 | #150 | Good 66.3% |
| Immigrants | Sudan | 76.0 /100 | #151 | Good 66.2% |
| Sudanese | 74.1 /100 | #152 | Good 66.2% |
| Belgians | 73.7 /100 | #153 | Good 66.2% |
| Immigrants | Eritrea | 71.9 /100 | #154 | Good 66.1% |
| Irish | 70.3 /100 | #155 | Good 66.0% |
| Welsh | 69.9 /100 | #156 | Good 66.0% |
| Sierra Leoneans | 67.8 /100 | #157 | Good 66.0% |
| Celtics | 67.3 /100 | #158 | Good 65.9% |
| Tlingit-Haida | 66.4 /100 | #159 | Good 65.9% |
| Albanians | 66.1 /100 | #160 | Good 65.9% |