New Zealander vs Belgian College, Under 1 year
COMPARE
New Zealander
Belgian
College, Under 1 year
College, Under 1 year Comparison
New Zealanders
Belgians
70.2%
COLLEGE, UNDER 1 YEAR
99.9/ 100
METRIC RATING
44th/ 347
METRIC RANK
66.2%
COLLEGE, UNDER 1 YEAR
73.7/ 100
METRIC RATING
153rd/ 347
METRIC RANK
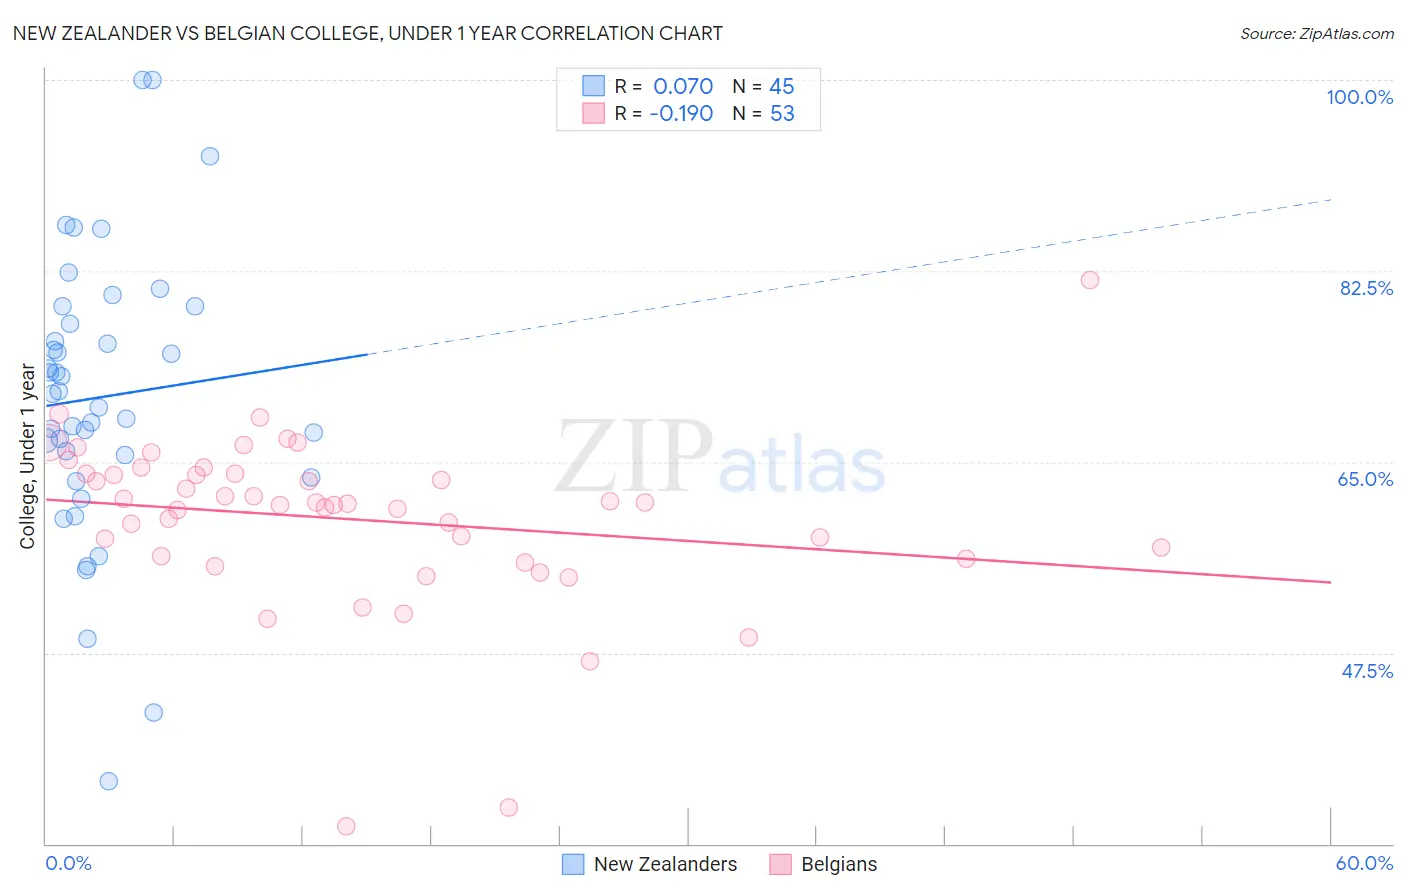
New Zealander vs Belgian College, Under 1 year Correlation Chart
The statistical analysis conducted on geographies consisting of 106,918,889 people shows a slight positive correlation between the proportion of New Zealanders and percentage of population with at least college, under 1 year education in the United States with a correlation coefficient (R) of 0.070 and weighted average of 70.2%. Similarly, the statistical analysis conducted on geographies consisting of 356,017,450 people shows a poor negative correlation between the proportion of Belgians and percentage of population with at least college, under 1 year education in the United States with a correlation coefficient (R) of -0.190 and weighted average of 66.2%, a difference of 6.1%.
College, Under 1 year Correlation Summary
| Measurement | New Zealander | Belgian |
| Minimum | 35.8% | 31.6% |
| Maximum | 100.0% | 81.6% |
| Range | 64.2% | 50.1% |
| Mean | 70.9% | 59.8% |
| Median | 71.2% | 61.1% |
| Interquartile 25% (IQ1) | 64.6% | 56.3% |
| Interquartile 75% (IQ3) | 78.5% | 63.9% |
| Interquartile Range (IQR) | 13.9% | 7.6% |
| Standard Deviation (Sample) | 12.9% | 8.0% |
| Standard Deviation (Population) | 12.8% | 7.9% |
Similar Demographics by College, Under 1 year
Demographics Similar to New Zealanders by College, Under 1 year
In terms of college, under 1 year, the demographic groups most similar to New Zealanders are Israeli (70.2%, a difference of 0.0%), Immigrants from Norway (70.2%, a difference of 0.020%), Immigrants from Lithuania (70.3%, a difference of 0.070%), Immigrants from Kuwait (70.3%, a difference of 0.12%), and Immigrants from Latvia (70.1%, a difference of 0.14%).
| Demographics | Rating | Rank | College, Under 1 year |
| Immigrants | Saudi Arabia | 99.9 /100 | #37 | Exceptional 70.4% |
| Australians | 99.9 /100 | #38 | Exceptional 70.4% |
| Bhutanese | 99.9 /100 | #39 | Exceptional 70.3% |
| Immigrants | Turkey | 99.9 /100 | #40 | Exceptional 70.3% |
| Immigrants | Kuwait | 99.9 /100 | #41 | Exceptional 70.3% |
| Immigrants | Lithuania | 99.9 /100 | #42 | Exceptional 70.3% |
| Israelis | 99.9 /100 | #43 | Exceptional 70.2% |
| New Zealanders | 99.9 /100 | #44 | Exceptional 70.2% |
| Immigrants | Norway | 99.9 /100 | #45 | Exceptional 70.2% |
| Immigrants | Latvia | 99.9 /100 | #46 | Exceptional 70.1% |
| Immigrants | Bulgaria | 99.8 /100 | #47 | Exceptional 70.0% |
| Immigrants | Netherlands | 99.8 /100 | #48 | Exceptional 70.0% |
| Immigrants | Austria | 99.8 /100 | #49 | Exceptional 70.0% |
| Zimbabweans | 99.8 /100 | #50 | Exceptional 69.9% |
| Mongolians | 99.8 /100 | #51 | Exceptional 69.9% |
Demographics Similar to Belgians by College, Under 1 year
In terms of college, under 1 year, the demographic groups most similar to Belgians are Sudanese (66.2%, a difference of 0.020%), Immigrants from Eritrea (66.1%, a difference of 0.10%), Immigrants from Sudan (66.2%, a difference of 0.13%), Irish (66.0%, a difference of 0.18%), and Immigrants from Iraq (66.3%, a difference of 0.20%).
| Demographics | Rating | Rank | College, Under 1 year |
| Kenyans | 81.7 /100 | #146 | Excellent 66.5% |
| Immigrants | Morocco | 81.7 /100 | #147 | Excellent 66.5% |
| Taiwanese | 78.6 /100 | #148 | Good 66.4% |
| Immigrants | Venezuela | 77.9 /100 | #149 | Good 66.3% |
| Immigrants | Iraq | 77.1 /100 | #150 | Good 66.3% |
| Immigrants | Sudan | 76.0 /100 | #151 | Good 66.2% |
| Sudanese | 74.1 /100 | #152 | Good 66.2% |
| Belgians | 73.7 /100 | #153 | Good 66.2% |
| Immigrants | Eritrea | 71.9 /100 | #154 | Good 66.1% |
| Irish | 70.3 /100 | #155 | Good 66.0% |
| Welsh | 69.9 /100 | #156 | Good 66.0% |
| Sierra Leoneans | 67.8 /100 | #157 | Good 66.0% |
| Celtics | 67.3 /100 | #158 | Good 65.9% |
| Tlingit-Haida | 66.4 /100 | #159 | Good 65.9% |
| Albanians | 66.1 /100 | #160 | Good 65.9% |