Syrian vs Belgian Female Poverty Among 18-24 Year Olds
COMPARE
Syrian
Belgian
Female Poverty Among 18-24 Year Olds
Female Poverty Among 18-24 Year Olds Comparison
Syrians
Belgians
19.8%
FEMALE POVERTY AMONG 18-24 YEAR OLDS
80.2/ 100
METRIC RATING
150th/ 347
METRIC RANK
19.9%
FEMALE POVERTY AMONG 18-24 YEAR OLDS
69.1/ 100
METRIC RATING
166th/ 347
METRIC RANK
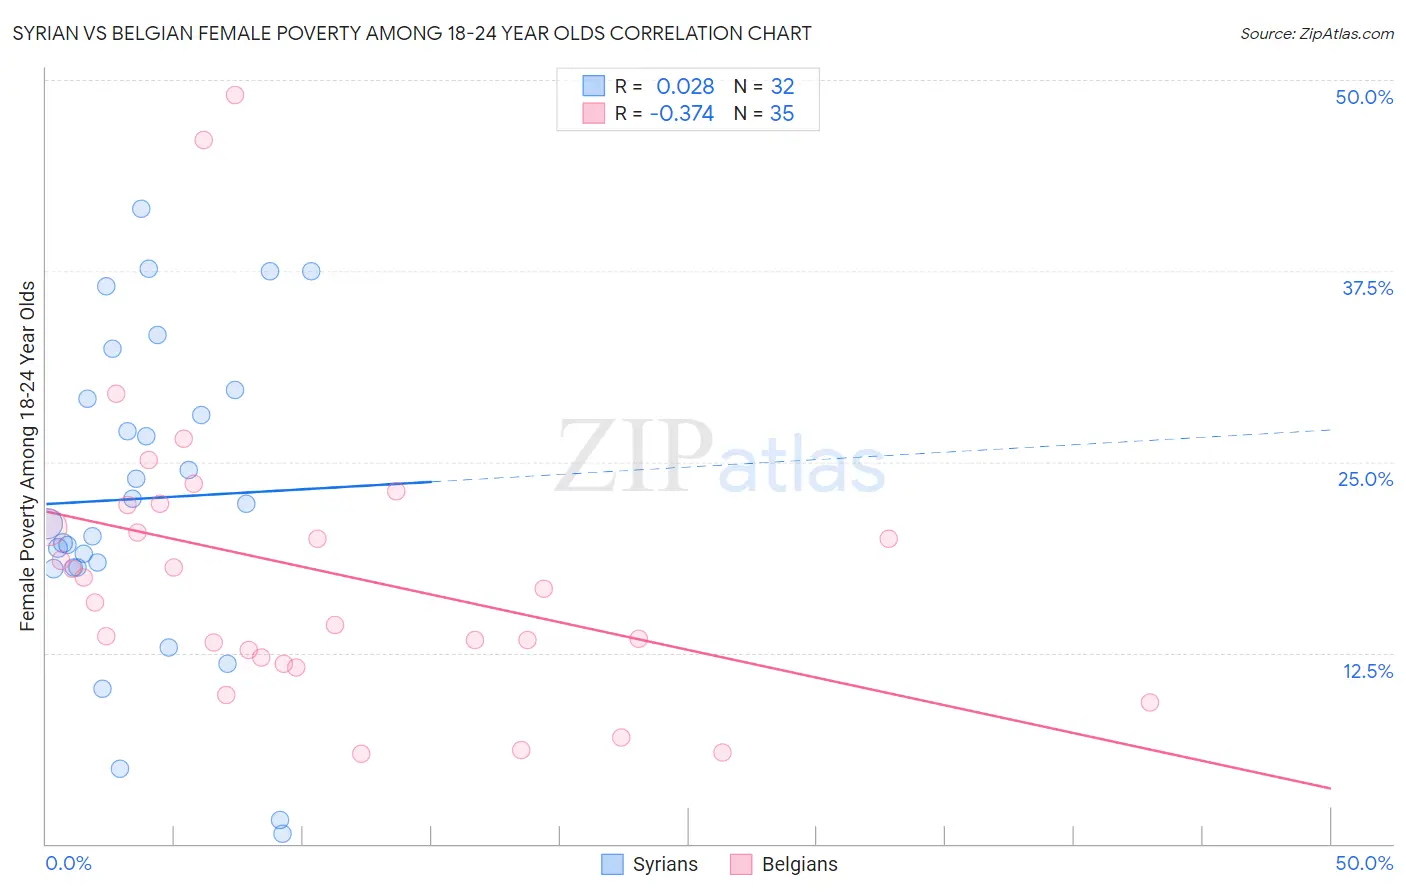
Syrian vs Belgian Female Poverty Among 18-24 Year Olds Correlation Chart
The statistical analysis conducted on geographies consisting of 261,305,691 people shows no correlation between the proportion of Syrians and poverty level among females between the ages 18 and 24 in the United States with a correlation coefficient (R) of 0.028 and weighted average of 19.8%. Similarly, the statistical analysis conducted on geographies consisting of 345,924,270 people shows a mild negative correlation between the proportion of Belgians and poverty level among females between the ages 18 and 24 in the United States with a correlation coefficient (R) of -0.374 and weighted average of 19.9%, a difference of 0.74%.
Female Poverty Among 18-24 Year Olds Correlation Summary
| Measurement | Syrian | Belgian |
| Minimum | 0.69% | 5.9% |
| Maximum | 41.6% | 49.0% |
| Range | 40.9% | 43.1% |
| Mean | 22.6% | 17.9% |
| Median | 21.6% | 16.7% |
| Interquartile 25% (IQ1) | 18.1% | 12.2% |
| Interquartile 75% (IQ3) | 29.4% | 22.2% |
| Interquartile Range (IQR) | 11.4% | 10.0% |
| Standard Deviation (Sample) | 10.4% | 9.5% |
| Standard Deviation (Population) | 10.2% | 9.4% |
Demographics Similar to Syrians and Belgians by Female Poverty Among 18-24 Year Olds
In terms of female poverty among 18-24 year olds, the demographic groups most similar to Syrians are Immigrants from Eastern Asia (19.8%, a difference of 0.040%), Immigrants from Oceania (19.7%, a difference of 0.080%), Immigrants from Latin America (19.7%, a difference of 0.090%), Yugoslavian (19.8%, a difference of 0.090%), and Immigrants from Japan (19.8%, a difference of 0.16%). Similarly, the demographic groups most similar to Belgians are Eastern European (19.9%, a difference of 0.010%), Central American (19.9%, a difference of 0.050%), Malaysian (19.9%, a difference of 0.21%), French Canadian (19.9%, a difference of 0.24%), and Immigrants from Belize (19.8%, a difference of 0.30%).
| Demographics | Rating | Rank | Female Poverty Among 18-24 Year Olds |
| Immigrants | Latin America | 81.3 /100 | #148 | Excellent 19.7% |
| Immigrants | Oceania | 81.2 /100 | #149 | Excellent 19.7% |
| Syrians | 80.2 /100 | #150 | Excellent 19.8% |
| Immigrants | Eastern Asia | 79.7 /100 | #151 | Good 19.8% |
| Yugoslavians | 79.0 /100 | #152 | Good 19.8% |
| Immigrants | Japan | 78.1 /100 | #153 | Good 19.8% |
| Immigrants | Zimbabwe | 76.7 /100 | #154 | Good 19.8% |
| Hungarians | 76.6 /100 | #155 | Good 19.8% |
| Immigrants | Belgium | 76.4 /100 | #156 | Good 19.8% |
| Danes | 75.5 /100 | #157 | Good 19.8% |
| Immigrants | Lebanon | 75.3 /100 | #158 | Good 19.8% |
| Trinidadians and Tobagonians | 74.4 /100 | #159 | Good 19.8% |
| Pakistanis | 74.1 /100 | #160 | Good 19.8% |
| Immigrants | Belize | 74.1 /100 | #161 | Good 19.8% |
| French Canadians | 73.0 /100 | #162 | Good 19.9% |
| Malaysians | 72.7 /100 | #163 | Good 19.9% |
| Central Americans | 70.0 /100 | #164 | Good 19.9% |
| Eastern Europeans | 69.3 /100 | #165 | Good 19.9% |
| Belgians | 69.1 /100 | #166 | Good 19.9% |
| Czechoslovakians | 61.8 /100 | #167 | Good 20.0% |
| Fijians | 59.1 /100 | #168 | Average 20.0% |