Immigrants from West Indies vs Belgian College, Under 1 year
COMPARE
Immigrants from West Indies
Belgian
College, Under 1 year
College, Under 1 year Comparison
Immigrants from West Indies
Belgians
60.6%
COLLEGE, UNDER 1 YEAR
0.1/ 100
METRIC RATING
269th/ 347
METRIC RANK
66.2%
COLLEGE, UNDER 1 YEAR
73.7/ 100
METRIC RATING
153rd/ 347
METRIC RANK
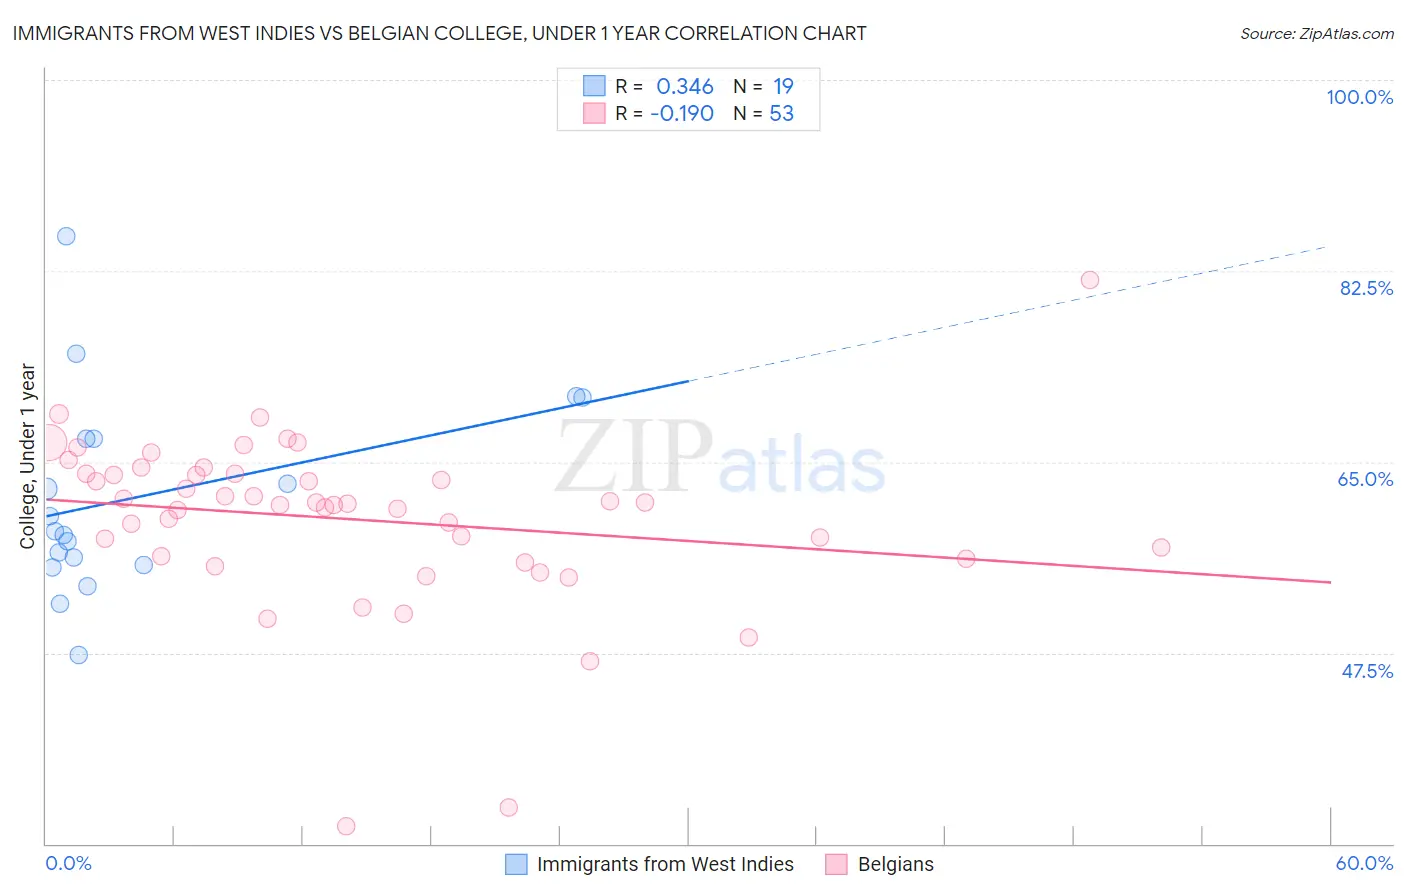
Immigrants from West Indies vs Belgian College, Under 1 year Correlation Chart
The statistical analysis conducted on geographies consisting of 72,457,514 people shows a mild positive correlation between the proportion of Immigrants from West Indies and percentage of population with at least college, under 1 year education in the United States with a correlation coefficient (R) of 0.346 and weighted average of 60.6%. Similarly, the statistical analysis conducted on geographies consisting of 356,017,450 people shows a poor negative correlation between the proportion of Belgians and percentage of population with at least college, under 1 year education in the United States with a correlation coefficient (R) of -0.190 and weighted average of 66.2%, a difference of 9.1%.
College, Under 1 year Correlation Summary
| Measurement | Immigrants from West Indies | Belgian |
| Minimum | 47.3% | 31.6% |
| Maximum | 85.6% | 81.6% |
| Range | 38.3% | 50.1% |
| Mean | 61.8% | 59.8% |
| Median | 58.6% | 61.1% |
| Interquartile 25% (IQ1) | 55.5% | 56.3% |
| Interquartile 75% (IQ3) | 67.2% | 63.9% |
| Interquartile Range (IQR) | 11.6% | 7.6% |
| Standard Deviation (Sample) | 9.2% | 8.0% |
| Standard Deviation (Population) | 8.9% | 7.9% |
Similar Demographics by College, Under 1 year
Demographics Similar to Immigrants from West Indies by College, Under 1 year
In terms of college, under 1 year, the demographic groups most similar to Immigrants from West Indies are Cheyenne (60.6%, a difference of 0.11%), Immigrants from Trinidad and Tobago (60.7%, a difference of 0.12%), U.S. Virgin Islander (60.6%, a difference of 0.13%), Jamaican (60.5%, a difference of 0.28%), and Chickasaw (60.4%, a difference of 0.33%).
| Demographics | Rating | Rank | College, Under 1 year |
| Barbadians | 0.2 /100 | #262 | Tragic 61.1% |
| Shoshone | 0.2 /100 | #263 | Tragic 61.1% |
| Trinidadians and Tobagonians | 0.2 /100 | #264 | Tragic 61.1% |
| Immigrants | Bahamas | 0.2 /100 | #265 | Tragic 61.1% |
| Alaskan Athabascans | 0.2 /100 | #266 | Tragic 61.0% |
| Americans | 0.2 /100 | #267 | Tragic 61.0% |
| Immigrants | Trinidad and Tobago | 0.1 /100 | #268 | Tragic 60.7% |
| Immigrants | West Indies | 0.1 /100 | #269 | Tragic 60.6% |
| Cheyenne | 0.1 /100 | #270 | Tragic 60.6% |
| U.S. Virgin Islanders | 0.1 /100 | #271 | Tragic 60.6% |
| Jamaicans | 0.1 /100 | #272 | Tragic 60.5% |
| Chickasaw | 0.1 /100 | #273 | Tragic 60.4% |
| Alaska Natives | 0.1 /100 | #274 | Tragic 60.4% |
| Immigrants | Barbados | 0.1 /100 | #275 | Tragic 60.4% |
| Arapaho | 0.1 /100 | #276 | Tragic 60.3% |
Demographics Similar to Belgians by College, Under 1 year
In terms of college, under 1 year, the demographic groups most similar to Belgians are Sudanese (66.2%, a difference of 0.020%), Immigrants from Eritrea (66.1%, a difference of 0.10%), Immigrants from Sudan (66.2%, a difference of 0.13%), Irish (66.0%, a difference of 0.18%), and Immigrants from Iraq (66.3%, a difference of 0.20%).
| Demographics | Rating | Rank | College, Under 1 year |
| Kenyans | 81.7 /100 | #146 | Excellent 66.5% |
| Immigrants | Morocco | 81.7 /100 | #147 | Excellent 66.5% |
| Taiwanese | 78.6 /100 | #148 | Good 66.4% |
| Immigrants | Venezuela | 77.9 /100 | #149 | Good 66.3% |
| Immigrants | Iraq | 77.1 /100 | #150 | Good 66.3% |
| Immigrants | Sudan | 76.0 /100 | #151 | Good 66.2% |
| Sudanese | 74.1 /100 | #152 | Good 66.2% |
| Belgians | 73.7 /100 | #153 | Good 66.2% |
| Immigrants | Eritrea | 71.9 /100 | #154 | Good 66.1% |
| Irish | 70.3 /100 | #155 | Good 66.0% |
| Welsh | 69.9 /100 | #156 | Good 66.0% |
| Sierra Leoneans | 67.8 /100 | #157 | Good 66.0% |
| Celtics | 67.3 /100 | #158 | Good 65.9% |
| Tlingit-Haida | 66.4 /100 | #159 | Good 65.9% |
| Albanians | 66.1 /100 | #160 | Good 65.9% |