Syrian vs Belgian 10th Grade
COMPARE
Syrian
Belgian
10th Grade
10th Grade Comparison
Syrians
Belgians
94.5%
10TH GRADE
97.7/ 100
METRIC RATING
101st/ 347
METRIC RANK
95.4%
10TH GRADE
100.0/ 100
METRIC RATING
30th/ 347
METRIC RANK
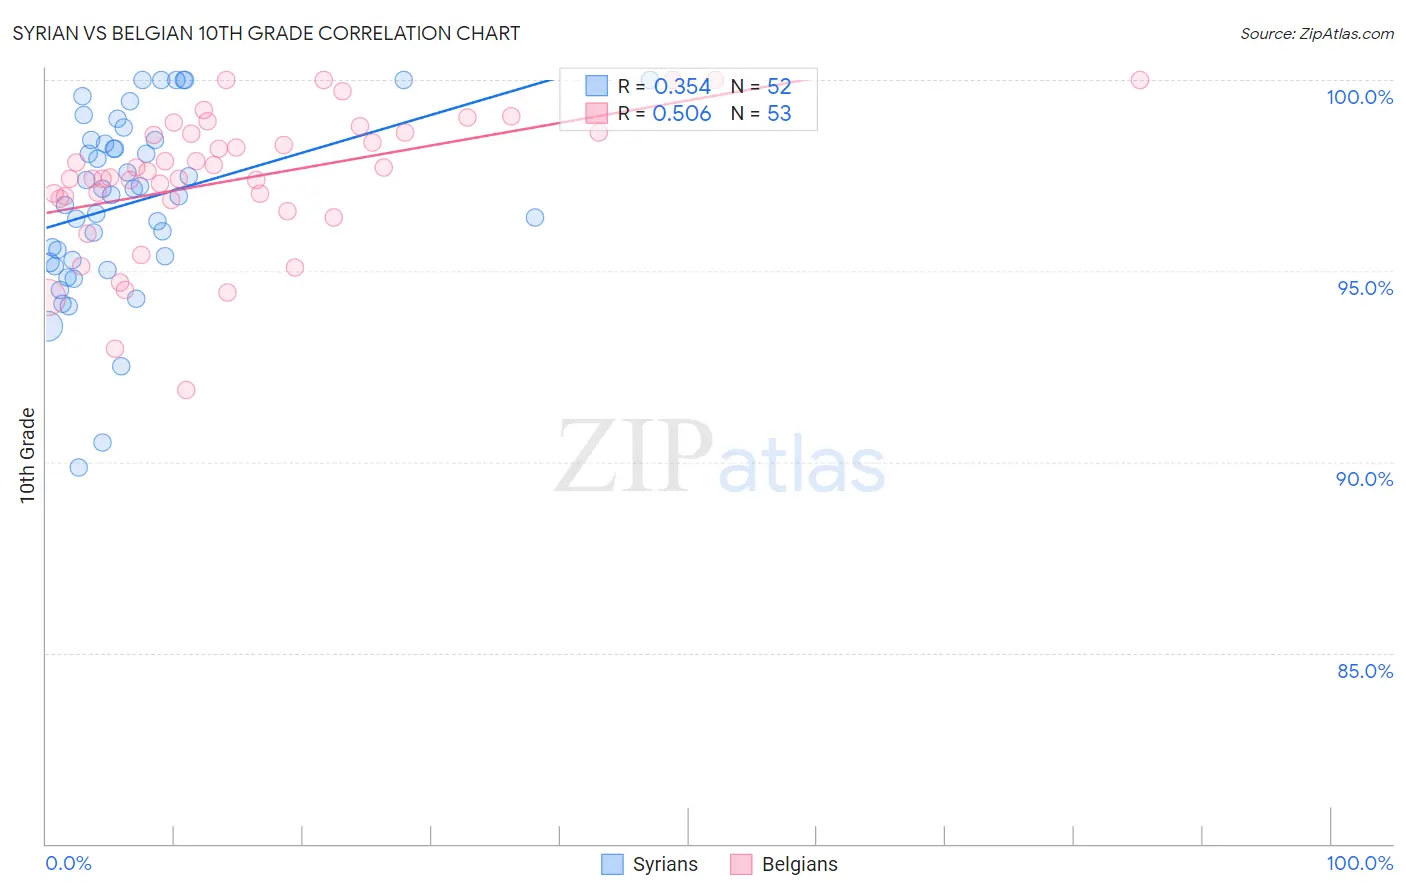
Syrian vs Belgian 10th Grade Correlation Chart
The statistical analysis conducted on geographies consisting of 266,305,988 people shows a mild positive correlation between the proportion of Syrians and percentage of population with at least 10th grade education in the United States with a correlation coefficient (R) of 0.354 and weighted average of 94.5%. Similarly, the statistical analysis conducted on geographies consisting of 356,019,281 people shows a substantial positive correlation between the proportion of Belgians and percentage of population with at least 10th grade education in the United States with a correlation coefficient (R) of 0.506 and weighted average of 95.4%, a difference of 0.88%.
10th Grade Correlation Summary
| Measurement | Syrian | Belgian |
| Minimum | 89.8% | 91.9% |
| Maximum | 100.0% | 100.0% |
| Range | 10.2% | 8.1% |
| Mean | 96.8% | 97.4% |
| Median | 97.1% | 97.6% |
| Interquartile 25% (IQ1) | 95.3% | 96.9% |
| Interquartile 75% (IQ3) | 98.4% | 98.6% |
| Interquartile Range (IQR) | 3.2% | 1.7% |
| Standard Deviation (Sample) | 2.4% | 1.8% |
| Standard Deviation (Population) | 2.3% | 1.8% |
Similar Demographics by 10th Grade
Demographics Similar to Syrians by 10th Grade
In terms of 10th grade, the demographic groups most similar to Syrians are Immigrants from South Central Asia (94.5%, a difference of 0.0%), Cambodian (94.5%, a difference of 0.010%), Immigrants from France (94.5%, a difference of 0.020%), Immigrants from Europe (94.5%, a difference of 0.020%), and Immigrants from Romania (94.5%, a difference of 0.020%).
| Demographics | Rating | Rank | 10th Grade |
| Immigrants | Germany | 98.3 /100 | #94 | Exceptional 94.6% |
| Menominee | 98.3 /100 | #95 | Exceptional 94.6% |
| Immigrants | Switzerland | 98.3 /100 | #96 | Exceptional 94.6% |
| Lebanese | 98.3 /100 | #97 | Exceptional 94.6% |
| Immigrants | Bulgaria | 98.1 /100 | #98 | Exceptional 94.6% |
| Immigrants | France | 97.9 /100 | #99 | Exceptional 94.5% |
| Immigrants | South Central Asia | 97.8 /100 | #100 | Exceptional 94.5% |
| Syrians | 97.7 /100 | #101 | Exceptional 94.5% |
| Cambodians | 97.6 /100 | #102 | Exceptional 94.5% |
| Immigrants | Europe | 97.5 /100 | #103 | Exceptional 94.5% |
| Immigrants | Romania | 97.5 /100 | #104 | Exceptional 94.5% |
| Immigrants | Turkey | 97.4 /100 | #105 | Exceptional 94.5% |
| Immigrants | Serbia | 97.4 /100 | #106 | Exceptional 94.5% |
| Immigrants | Croatia | 97.4 /100 | #107 | Exceptional 94.5% |
| Immigrants | North Macedonia | 97.2 /100 | #108 | Exceptional 94.5% |
Demographics Similar to Belgians by 10th Grade
In terms of 10th grade, the demographic groups most similar to Belgians are Iranian (95.3%, a difference of 0.020%), Hungarian (95.3%, a difference of 0.020%), French (95.3%, a difference of 0.030%), British (95.3%, a difference of 0.030%), and Estonian (95.3%, a difference of 0.040%).
| Demographics | Rating | Rank | 10th Grade |
| Czechs | 100.0 /100 | #23 | Exceptional 95.5% |
| Europeans | 100.0 /100 | #24 | Exceptional 95.5% |
| Maltese | 100.0 /100 | #25 | Exceptional 95.5% |
| Welsh | 100.0 /100 | #26 | Exceptional 95.5% |
| Alaskan Athabascans | 100.0 /100 | #27 | Exceptional 95.4% |
| Luxembourgers | 100.0 /100 | #28 | Exceptional 95.4% |
| Bulgarians | 100.0 /100 | #29 | Exceptional 95.4% |
| Belgians | 100.0 /100 | #30 | Exceptional 95.4% |
| Iranians | 100.0 /100 | #31 | Exceptional 95.3% |
| Hungarians | 100.0 /100 | #32 | Exceptional 95.3% |
| French | 100.0 /100 | #33 | Exceptional 95.3% |
| British | 99.9 /100 | #34 | Exceptional 95.3% |
| Estonians | 99.9 /100 | #35 | Exceptional 95.3% |
| Immigrants | India | 99.9 /100 | #36 | Exceptional 95.3% |
| French Canadians | 99.9 /100 | #37 | Exceptional 95.3% |