Syrian vs Moroccan College, Under 1 year
COMPARE
Syrian
Moroccan
College, Under 1 year
College, Under 1 year Comparison
Syrians
Moroccans
67.6%
COLLEGE, UNDER 1 YEAR
95.6/ 100
METRIC RATING
113th/ 347
METRIC RANK
65.6%
COLLEGE, UNDER 1 YEAR
56.7/ 100
METRIC RATING
166th/ 347
METRIC RANK
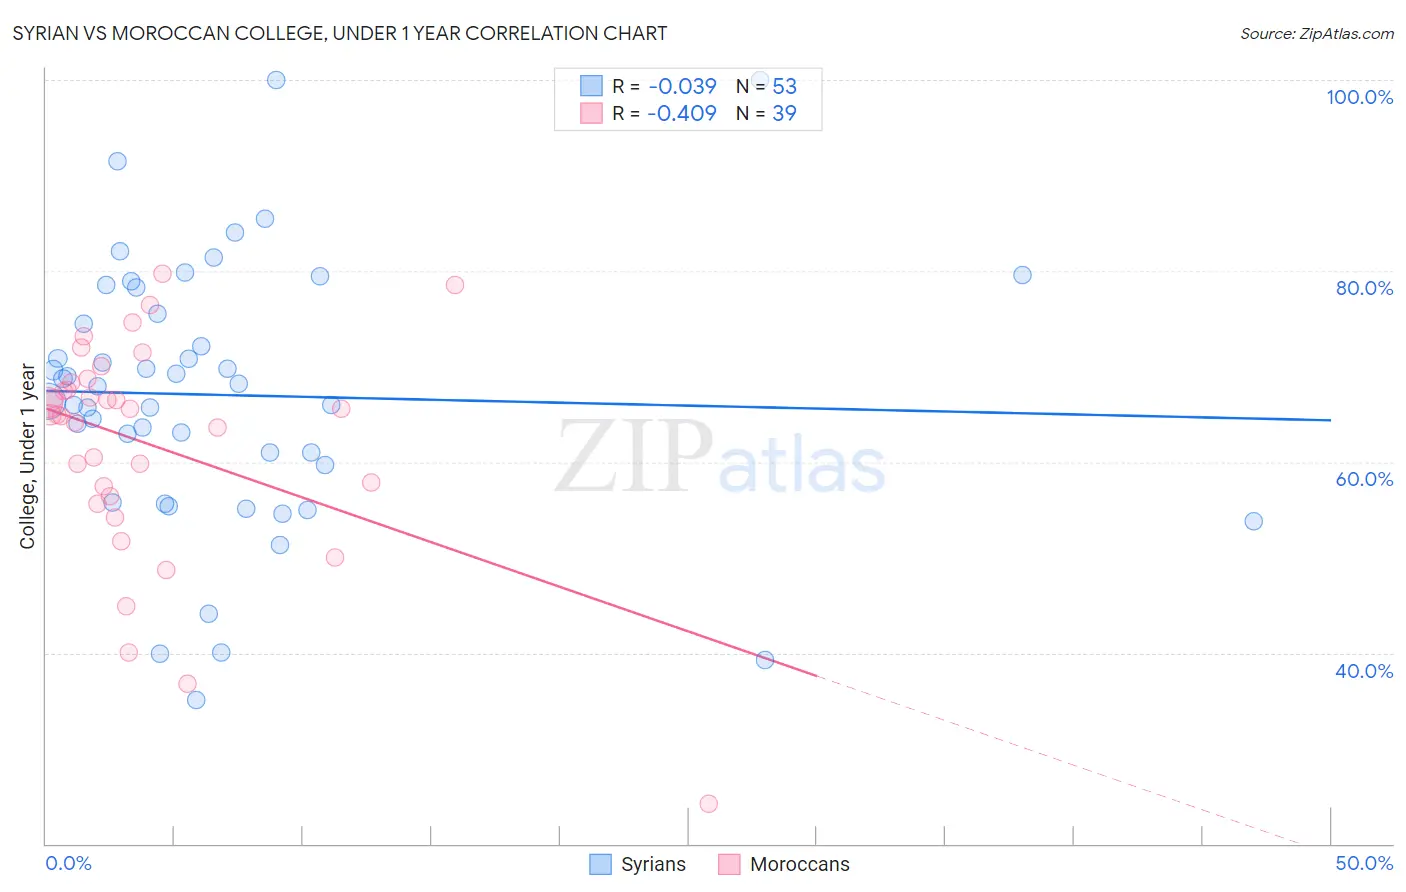
Syrian vs Moroccan College, Under 1 year Correlation Chart
The statistical analysis conducted on geographies consisting of 266,306,496 people shows no correlation between the proportion of Syrians and percentage of population with at least college, under 1 year education in the United States with a correlation coefficient (R) of -0.039 and weighted average of 67.6%. Similarly, the statistical analysis conducted on geographies consisting of 201,817,667 people shows a moderate negative correlation between the proportion of Moroccans and percentage of population with at least college, under 1 year education in the United States with a correlation coefficient (R) of -0.409 and weighted average of 65.6%, a difference of 3.1%.
College, Under 1 year Correlation Summary
| Measurement | Syrian | Moroccan |
| Minimum | 35.1% | 24.2% |
| Maximum | 100.0% | 79.7% |
| Range | 64.9% | 55.5% |
| Mean | 67.0% | 61.8% |
| Median | 68.0% | 64.9% |
| Interquartile 25% (IQ1) | 57.7% | 56.5% |
| Interquartile 75% (IQ3) | 76.9% | 68.4% |
| Interquartile Range (IQR) | 19.2% | 11.9% |
| Standard Deviation (Sample) | 14.0% | 11.6% |
| Standard Deviation (Population) | 13.9% | 11.4% |
Similar Demographics by College, Under 1 year
Demographics Similar to Syrians by College, Under 1 year
In terms of college, under 1 year, the demographic groups most similar to Syrians are Macedonian (67.6%, a difference of 0.030%), Assyrian/Chaldean/Syriac (67.7%, a difference of 0.040%), Ukrainian (67.7%, a difference of 0.040%), Scandinavian (67.7%, a difference of 0.050%), and Chilean (67.6%, a difference of 0.080%).
| Demographics | Rating | Rank | College, Under 1 year |
| Immigrants | Croatia | 96.6 /100 | #106 | Exceptional 67.8% |
| Austrians | 96.4 /100 | #107 | Exceptional 67.8% |
| Immigrants | Egypt | 96.0 /100 | #108 | Exceptional 67.7% |
| Scandinavians | 95.8 /100 | #109 | Exceptional 67.7% |
| Assyrians/Chaldeans/Syriacs | 95.8 /100 | #110 | Exceptional 67.7% |
| Ukrainians | 95.8 /100 | #111 | Exceptional 67.7% |
| Macedonians | 95.7 /100 | #112 | Exceptional 67.6% |
| Syrians | 95.6 /100 | #113 | Exceptional 67.6% |
| Chileans | 95.3 /100 | #114 | Exceptional 67.6% |
| Basques | 95.2 /100 | #115 | Exceptional 67.6% |
| Immigrants | Nepal | 94.9 /100 | #116 | Exceptional 67.5% |
| Pakistanis | 94.8 /100 | #117 | Exceptional 67.5% |
| Immigrants | Ukraine | 94.7 /100 | #118 | Exceptional 67.5% |
| Lebanese | 94.6 /100 | #119 | Exceptional 67.5% |
| Serbians | 93.9 /100 | #120 | Exceptional 67.4% |
Demographics Similar to Moroccans by College, Under 1 year
In terms of college, under 1 year, the demographic groups most similar to Moroccans are Immigrants from Somalia (65.6%, a difference of 0.010%), Hungarian (65.6%, a difference of 0.030%), Yugoslavian (65.6%, a difference of 0.040%), German (65.6%, a difference of 0.040%), and Immigrants from Oceania (65.6%, a difference of 0.080%).
| Demographics | Rating | Rank | College, Under 1 year |
| Tlingit-Haida | 66.4 /100 | #159 | Good 65.9% |
| Albanians | 66.1 /100 | #160 | Good 65.9% |
| Brazilians | 66.0 /100 | #161 | Good 65.9% |
| Koreans | 65.3 /100 | #162 | Good 65.9% |
| Somalis | 62.7 /100 | #163 | Good 65.8% |
| Czechoslovakians | 62.6 /100 | #164 | Good 65.8% |
| Immigrants | Uzbekistan | 61.6 /100 | #165 | Good 65.8% |
| Moroccans | 56.7 /100 | #166 | Average 65.6% |
| Immigrants | Somalia | 56.4 /100 | #167 | Average 65.6% |
| Hungarians | 55.9 /100 | #168 | Average 65.6% |
| Yugoslavians | 55.7 /100 | #169 | Average 65.6% |
| Germans | 55.7 /100 | #170 | Average 65.6% |
| Immigrants | Oceania | 55.0 /100 | #171 | Average 65.6% |
| South American Indians | 54.4 /100 | #172 | Average 65.5% |
| Swiss | 53.9 /100 | #173 | Average 65.5% |