Immigrants from Israel vs Central American College, Under 1 year
COMPARE
Immigrants from Israel
Central American
College, Under 1 year
College, Under 1 year Comparison
Immigrants from Israel
Central Americans
72.3%
COLLEGE, UNDER 1 YEAR
100.0/ 100
METRIC RATING
10th/ 347
METRIC RANK
57.7%
COLLEGE, UNDER 1 YEAR
0.0/ 100
METRIC RATING
308th/ 347
METRIC RANK
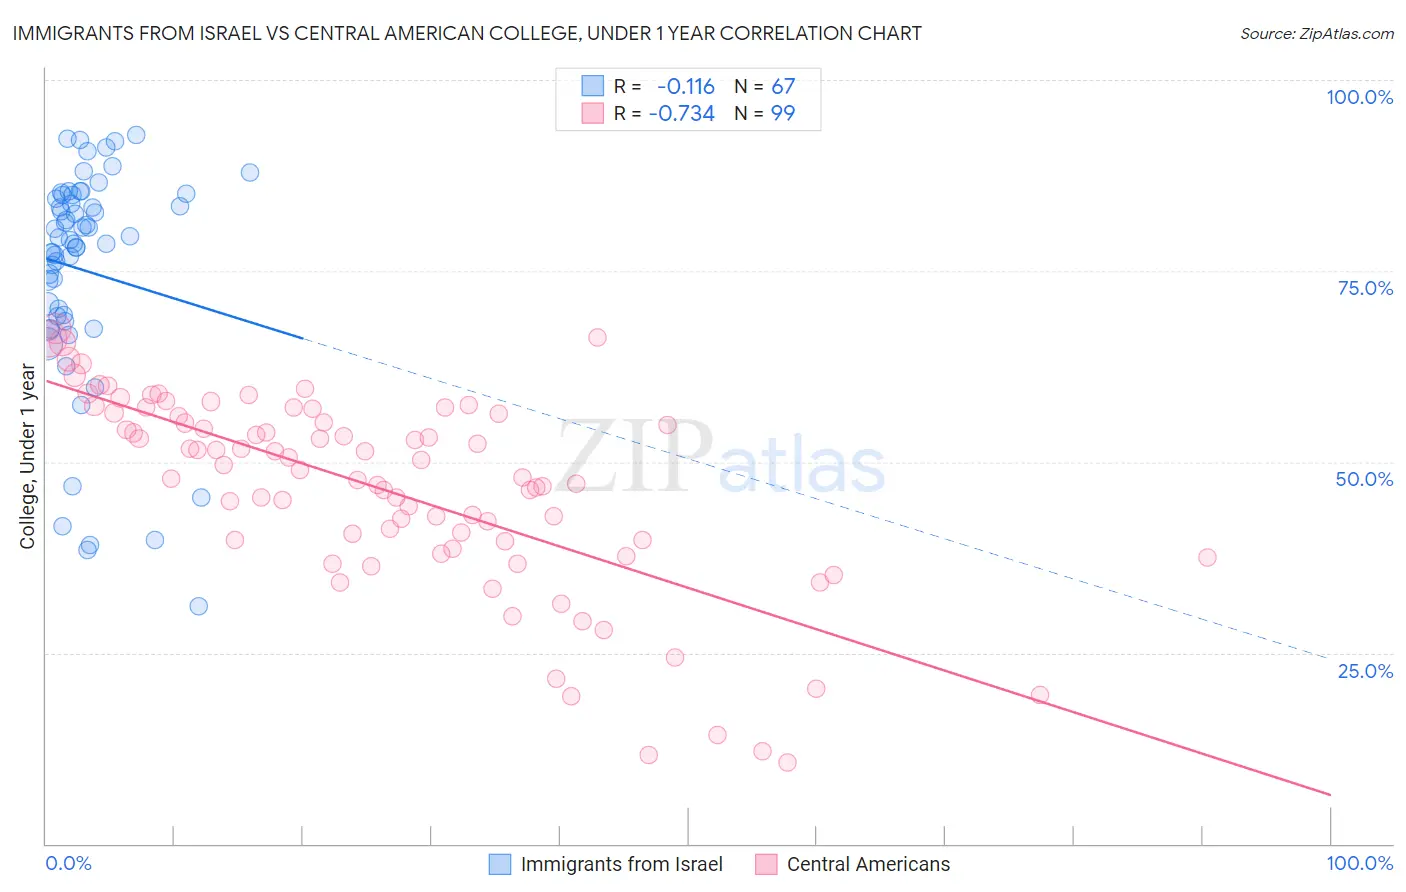
Immigrants from Israel vs Central American College, Under 1 year Correlation Chart
The statistical analysis conducted on geographies consisting of 210,030,735 people shows a poor negative correlation between the proportion of Immigrants from Israel and percentage of population with at least college, under 1 year education in the United States with a correlation coefficient (R) of -0.116 and weighted average of 72.3%. Similarly, the statistical analysis conducted on geographies consisting of 504,615,987 people shows a strong negative correlation between the proportion of Central Americans and percentage of population with at least college, under 1 year education in the United States with a correlation coefficient (R) of -0.734 and weighted average of 57.7%, a difference of 25.4%.
College, Under 1 year Correlation Summary
| Measurement | Immigrants from Israel | Central American |
| Minimum | 31.0% | 10.7% |
| Maximum | 92.7% | 67.5% |
| Range | 61.7% | 56.8% |
| Mean | 75.1% | 46.4% |
| Median | 79.1% | 48.9% |
| Interquartile 25% (IQ1) | 69.0% | 39.6% |
| Interquartile 75% (IQ3) | 84.9% | 56.3% |
| Interquartile Range (IQR) | 15.8% | 16.7% |
| Standard Deviation (Sample) | 14.4% | 13.0% |
| Standard Deviation (Population) | 14.3% | 12.9% |
Similar Demographics by College, Under 1 year
Demographics Similar to Immigrants from Israel by College, Under 1 year
In terms of college, under 1 year, the demographic groups most similar to Immigrants from Israel are Immigrants from South Central Asia (72.1%, a difference of 0.30%), Immigrants from Sweden (72.1%, a difference of 0.30%), Cypriot (72.0%, a difference of 0.46%), Cambodian (71.9%, a difference of 0.58%), and Burmese (71.9%, a difference of 0.58%).
| Demographics | Rating | Rank | College, Under 1 year |
| Immigrants | Singapore | 100.0 /100 | #3 | Exceptional 74.8% |
| Immigrants | India | 100.0 /100 | #4 | Exceptional 74.4% |
| Immigrants | Iran | 100.0 /100 | #5 | Exceptional 74.3% |
| Immigrants | Taiwan | 100.0 /100 | #6 | Exceptional 74.2% |
| Okinawans | 100.0 /100 | #7 | Exceptional 73.7% |
| Thais | 100.0 /100 | #8 | Exceptional 73.4% |
| Immigrants | Australia | 100.0 /100 | #9 | Exceptional 72.7% |
| Immigrants | Israel | 100.0 /100 | #10 | Exceptional 72.3% |
| Immigrants | South Central Asia | 100.0 /100 | #11 | Exceptional 72.1% |
| Immigrants | Sweden | 100.0 /100 | #12 | Exceptional 72.1% |
| Cypriots | 100.0 /100 | #13 | Exceptional 72.0% |
| Cambodians | 100.0 /100 | #14 | Exceptional 71.9% |
| Burmese | 100.0 /100 | #15 | Exceptional 71.9% |
| Immigrants | Japan | 100.0 /100 | #16 | Exceptional 71.9% |
| Eastern Europeans | 100.0 /100 | #17 | Exceptional 71.8% |
Demographics Similar to Central Americans by College, Under 1 year
In terms of college, under 1 year, the demographic groups most similar to Central Americans are Fijian (57.7%, a difference of 0.0%), Immigrants from Portugal (57.7%, a difference of 0.010%), Immigrants from Nicaragua (57.6%, a difference of 0.12%), Haitian (57.8%, a difference of 0.21%), and Kiowa (57.8%, a difference of 0.32%).
| Demographics | Rating | Rank | College, Under 1 year |
| Mexican American Indians | 0.0 /100 | #301 | Tragic 58.1% |
| Apache | 0.0 /100 | #302 | Tragic 58.0% |
| Immigrants | Dominica | 0.0 /100 | #303 | Tragic 57.9% |
| Kiowa | 0.0 /100 | #304 | Tragic 57.8% |
| Haitians | 0.0 /100 | #305 | Tragic 57.8% |
| Immigrants | Portugal | 0.0 /100 | #306 | Tragic 57.7% |
| Fijians | 0.0 /100 | #307 | Tragic 57.7% |
| Central Americans | 0.0 /100 | #308 | Tragic 57.7% |
| Immigrants | Nicaragua | 0.0 /100 | #309 | Tragic 57.6% |
| Pueblo | 0.0 /100 | #310 | Tragic 57.4% |
| Cajuns | 0.0 /100 | #311 | Tragic 57.3% |
| Salvadorans | 0.0 /100 | #312 | Tragic 57.3% |
| Dutch West Indians | 0.0 /100 | #313 | Tragic 57.2% |
| Hopi | 0.0 /100 | #314 | Tragic 57.1% |
| Hondurans | 0.0 /100 | #315 | Tragic 57.1% |