Swedish vs Immigrants from Liberia College, 1 year or more
COMPARE
Swedish
Immigrants from Liberia
College, 1 year or more
College, 1 year or more Comparison
Swedes
Immigrants from Liberia
62.1%
COLLEGE, 1 YEAR OR MORE
96.8/ 100
METRIC RATING
101st/ 347
METRIC RANK
55.7%
COLLEGE, 1 YEAR OR MORE
0.8/ 100
METRIC RATING
245th/ 347
METRIC RANK
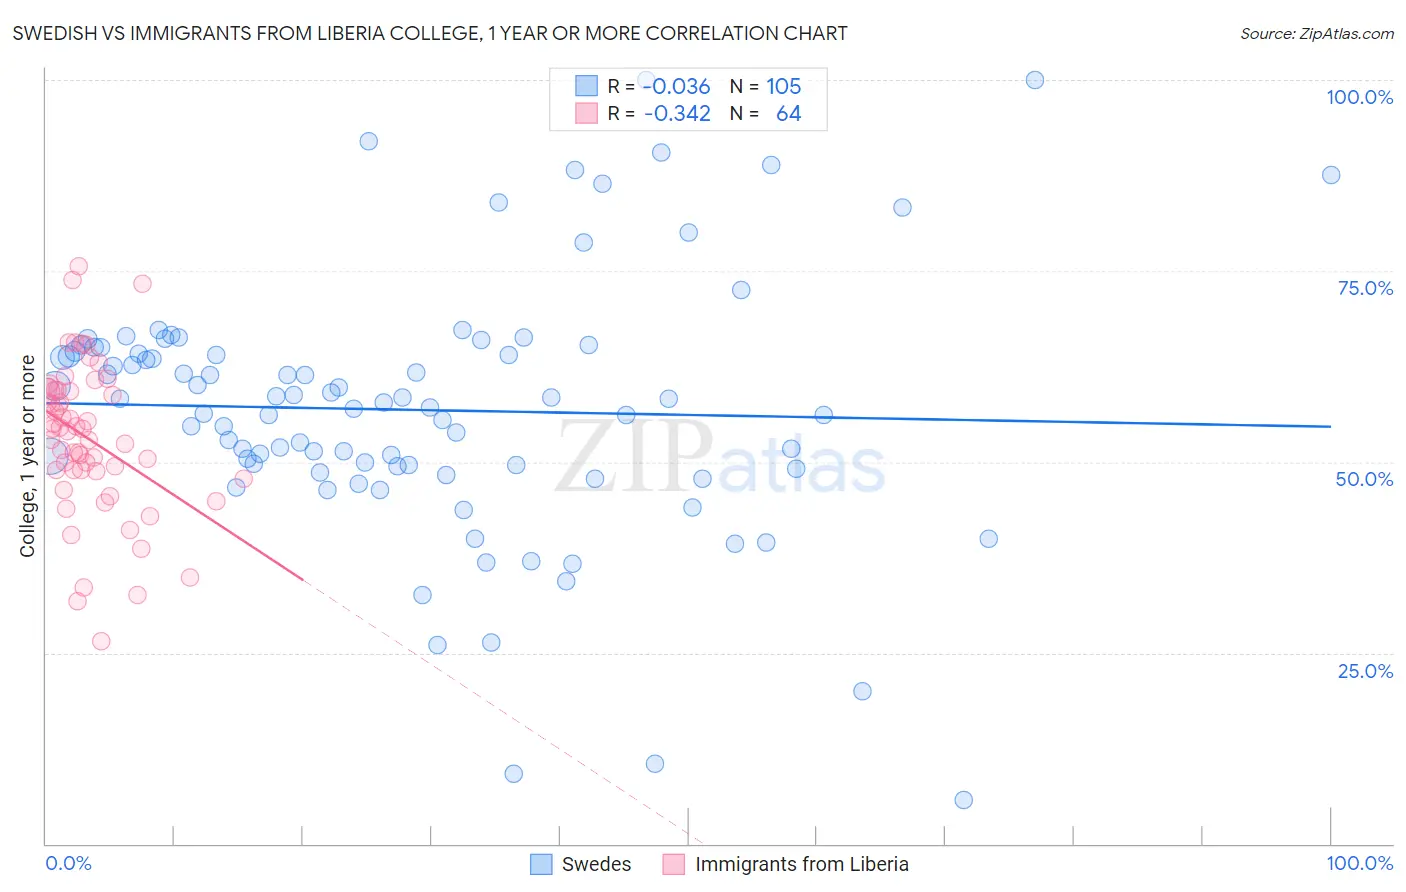
Swedish vs Immigrants from Liberia College, 1 year or more Correlation Chart
The statistical analysis conducted on geographies consisting of 539,224,370 people shows no correlation between the proportion of Swedes and percentage of population with at least college, 1 year or more education in the United States with a correlation coefficient (R) of -0.036 and weighted average of 62.1%. Similarly, the statistical analysis conducted on geographies consisting of 135,295,665 people shows a mild negative correlation between the proportion of Immigrants from Liberia and percentage of population with at least college, 1 year or more education in the United States with a correlation coefficient (R) of -0.342 and weighted average of 55.7%, a difference of 11.6%.
College, 1 year or more Correlation Summary
| Measurement | Swedish | Immigrants from Liberia |
| Minimum | 5.7% | 26.5% |
| Maximum | 100.0% | 75.6% |
| Range | 94.3% | 49.1% |
| Mean | 56.8% | 53.1% |
| Median | 57.8% | 54.2% |
| Interquartile 25% (IQ1) | 49.2% | 48.9% |
| Interquartile 75% (IQ3) | 64.7% | 59.4% |
| Interquartile Range (IQR) | 15.5% | 10.5% |
| Standard Deviation (Sample) | 16.9% | 9.9% |
| Standard Deviation (Population) | 16.9% | 9.8% |
Similar Demographics by College, 1 year or more
Demographics Similar to Swedes by College, 1 year or more
In terms of college, 1 year or more, the demographic groups most similar to Swedes are Icelander (62.1%, a difference of 0.0%), Luxembourger (62.1%, a difference of 0.020%), Afghan (62.0%, a difference of 0.13%), Chilean (62.0%, a difference of 0.14%), and Immigrants from Nepal (62.0%, a difference of 0.16%).
| Demographics | Rating | Rank | College, 1 year or more |
| Immigrants | Croatia | 97.6 /100 | #94 | Exceptional 62.3% |
| British | 97.4 /100 | #95 | Exceptional 62.3% |
| Chinese | 97.2 /100 | #96 | Exceptional 62.2% |
| Jordanians | 97.2 /100 | #97 | Exceptional 62.2% |
| Carpatho Rusyns | 97.2 /100 | #98 | Exceptional 62.2% |
| Croatians | 97.1 /100 | #99 | Exceptional 62.2% |
| Icelanders | 96.8 /100 | #100 | Exceptional 62.1% |
| Swedes | 96.8 /100 | #101 | Exceptional 62.1% |
| Luxembourgers | 96.7 /100 | #102 | Exceptional 62.1% |
| Afghans | 96.4 /100 | #103 | Exceptional 62.0% |
| Chileans | 96.4 /100 | #104 | Exceptional 62.0% |
| Immigrants | Nepal | 96.3 /100 | #105 | Exceptional 62.0% |
| Palestinians | 96.3 /100 | #106 | Exceptional 62.0% |
| Immigrants | Ukraine | 95.8 /100 | #107 | Exceptional 61.9% |
| Syrians | 95.7 /100 | #108 | Exceptional 61.9% |
Demographics Similar to Immigrants from Liberia by College, 1 year or more
In terms of college, 1 year or more, the demographic groups most similar to Immigrants from Liberia are Malaysian (55.6%, a difference of 0.050%), Chippewa (55.7%, a difference of 0.070%), Hawaiian (55.6%, a difference of 0.12%), Immigrants from Congo (55.6%, a difference of 0.16%), and Osage (55.8%, a difference of 0.19%).
| Demographics | Rating | Rank | College, 1 year or more |
| Barbadians | 1.3 /100 | #238 | Tragic 56.0% |
| Puget Sound Salish | 1.1 /100 | #239 | Tragic 55.9% |
| Trinidadians and Tobagonians | 1.1 /100 | #240 | Tragic 55.8% |
| French American Indians | 1.0 /100 | #241 | Tragic 55.8% |
| Marshallese | 1.0 /100 | #242 | Tragic 55.8% |
| Osage | 1.0 /100 | #243 | Tragic 55.8% |
| Chippewa | 0.9 /100 | #244 | Tragic 55.7% |
| Immigrants | Liberia | 0.8 /100 | #245 | Tragic 55.7% |
| Malaysians | 0.8 /100 | #246 | Tragic 55.6% |
| Hawaiians | 0.8 /100 | #247 | Tragic 55.6% |
| Immigrants | Congo | 0.8 /100 | #248 | Tragic 55.6% |
| Immigrants | Trinidad and Tobago | 0.7 /100 | #249 | Tragic 55.5% |
| Delaware | 0.7 /100 | #250 | Tragic 55.5% |
| Immigrants | Cambodia | 0.6 /100 | #251 | Tragic 55.4% |
| Aleuts | 0.6 /100 | #252 | Tragic 55.4% |