Swedish vs Cajun College, 1 year or more
COMPARE
Swedish
Cajun
College, 1 year or more
College, 1 year or more Comparison
Swedes
Cajuns
62.1%
COLLEGE, 1 YEAR OR MORE
96.8/ 100
METRIC RATING
101st/ 347
METRIC RANK
51.2%
COLLEGE, 1 YEAR OR MORE
0.0/ 100
METRIC RATING
316th/ 347
METRIC RANK
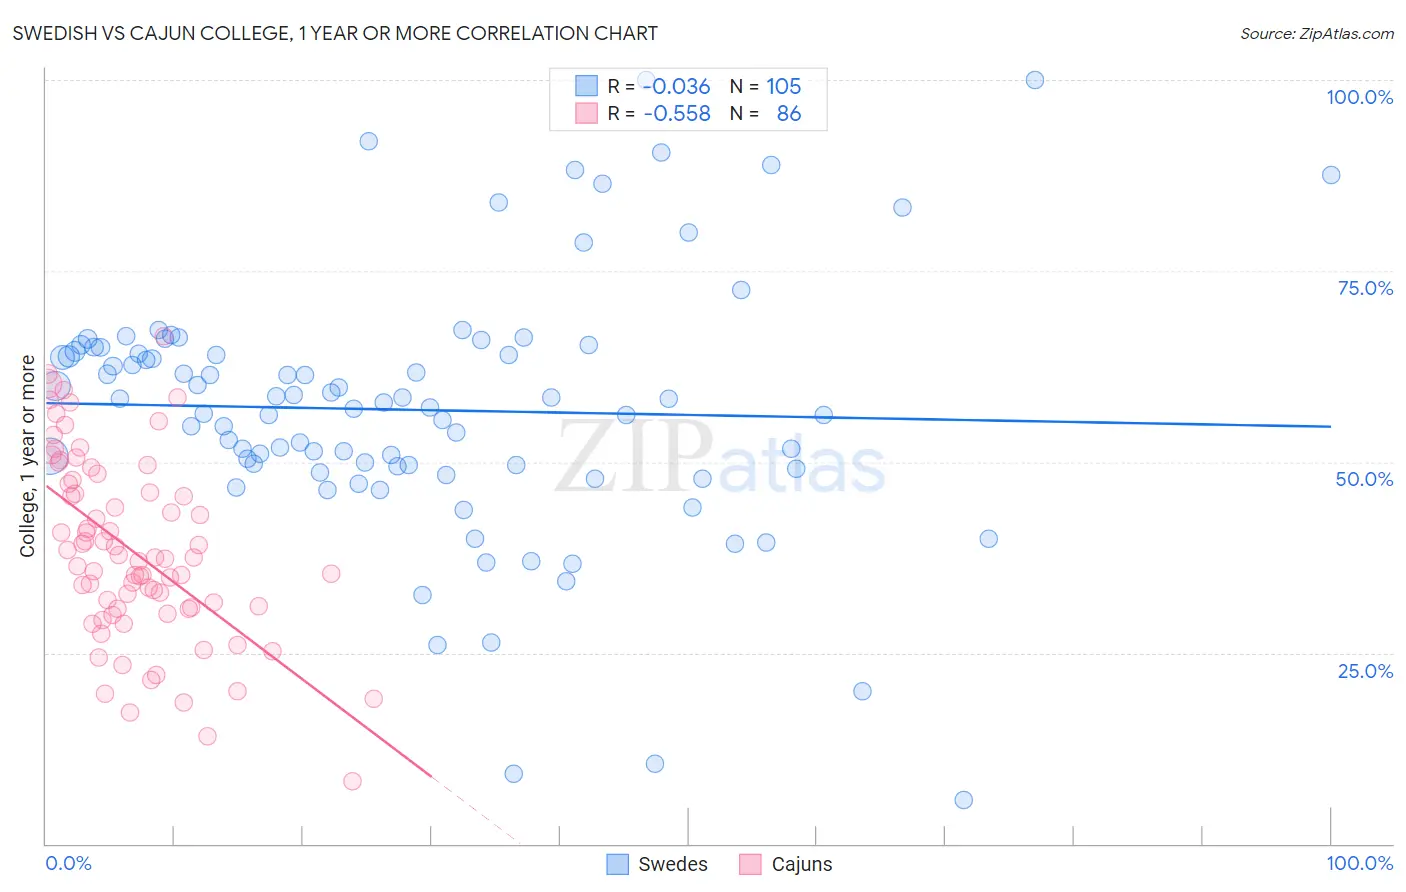
Swedish vs Cajun College, 1 year or more Correlation Chart
The statistical analysis conducted on geographies consisting of 539,224,370 people shows no correlation between the proportion of Swedes and percentage of population with at least college, 1 year or more education in the United States with a correlation coefficient (R) of -0.036 and weighted average of 62.1%. Similarly, the statistical analysis conducted on geographies consisting of 149,712,775 people shows a substantial negative correlation between the proportion of Cajuns and percentage of population with at least college, 1 year or more education in the United States with a correlation coefficient (R) of -0.558 and weighted average of 51.2%, a difference of 21.4%.
College, 1 year or more Correlation Summary
| Measurement | Swedish | Cajun |
| Minimum | 5.7% | 8.2% |
| Maximum | 100.0% | 66.4% |
| Range | 94.3% | 58.2% |
| Mean | 56.8% | 38.3% |
| Median | 57.8% | 37.4% |
| Interquartile 25% (IQ1) | 49.2% | 30.8% |
| Interquartile 75% (IQ3) | 64.7% | 47.1% |
| Interquartile Range (IQR) | 15.5% | 16.3% |
| Standard Deviation (Sample) | 16.9% | 12.0% |
| Standard Deviation (Population) | 16.9% | 11.9% |
Similar Demographics by College, 1 year or more
Demographics Similar to Swedes by College, 1 year or more
In terms of college, 1 year or more, the demographic groups most similar to Swedes are Icelander (62.1%, a difference of 0.0%), Luxembourger (62.1%, a difference of 0.020%), Afghan (62.0%, a difference of 0.13%), Chilean (62.0%, a difference of 0.14%), and Immigrants from Nepal (62.0%, a difference of 0.16%).
| Demographics | Rating | Rank | College, 1 year or more |
| Immigrants | Croatia | 97.6 /100 | #94 | Exceptional 62.3% |
| British | 97.4 /100 | #95 | Exceptional 62.3% |
| Chinese | 97.2 /100 | #96 | Exceptional 62.2% |
| Jordanians | 97.2 /100 | #97 | Exceptional 62.2% |
| Carpatho Rusyns | 97.2 /100 | #98 | Exceptional 62.2% |
| Croatians | 97.1 /100 | #99 | Exceptional 62.2% |
| Icelanders | 96.8 /100 | #100 | Exceptional 62.1% |
| Swedes | 96.8 /100 | #101 | Exceptional 62.1% |
| Luxembourgers | 96.7 /100 | #102 | Exceptional 62.1% |
| Afghans | 96.4 /100 | #103 | Exceptional 62.0% |
| Chileans | 96.4 /100 | #104 | Exceptional 62.0% |
| Immigrants | Nepal | 96.3 /100 | #105 | Exceptional 62.0% |
| Palestinians | 96.3 /100 | #106 | Exceptional 62.0% |
| Immigrants | Ukraine | 95.8 /100 | #107 | Exceptional 61.9% |
| Syrians | 95.7 /100 | #108 | Exceptional 61.9% |
Demographics Similar to Cajuns by College, 1 year or more
In terms of college, 1 year or more, the demographic groups most similar to Cajuns are Guatemalan (51.2%, a difference of 0.070%), Hispanic or Latino (51.1%, a difference of 0.090%), Immigrants from Honduras (51.0%, a difference of 0.22%), Fijian (51.3%, a difference of 0.30%), and Immigrants from El Salvador (51.0%, a difference of 0.31%).
| Demographics | Rating | Rank | College, 1 year or more |
| Apache | 0.0 /100 | #309 | Tragic 51.8% |
| Hondurans | 0.0 /100 | #310 | Tragic 51.6% |
| Immigrants | Haiti | 0.0 /100 | #311 | Tragic 51.5% |
| Pueblo | 0.0 /100 | #312 | Tragic 51.5% |
| Immigrants | Caribbean | 0.0 /100 | #313 | Tragic 51.4% |
| Fijians | 0.0 /100 | #314 | Tragic 51.3% |
| Guatemalans | 0.0 /100 | #315 | Tragic 51.2% |
| Cajuns | 0.0 /100 | #316 | Tragic 51.2% |
| Hispanics or Latinos | 0.0 /100 | #317 | Tragic 51.1% |
| Immigrants | Honduras | 0.0 /100 | #318 | Tragic 51.0% |
| Immigrants | El Salvador | 0.0 /100 | #319 | Tragic 51.0% |
| Kiowa | 0.0 /100 | #320 | Tragic 51.0% |
| Hopi | 0.0 /100 | #321 | Tragic 50.9% |
| Navajo | 0.0 /100 | #322 | Tragic 50.8% |
| Immigrants | Guatemala | 0.0 /100 | #323 | Tragic 50.7% |