Swedish vs Yaqui College, 1 year or more
COMPARE
Swedish
Yaqui
College, 1 year or more
College, 1 year or more Comparison
Swedes
Yaqui
62.1%
COLLEGE, 1 YEAR OR MORE
96.8/ 100
METRIC RATING
101st/ 347
METRIC RANK
53.2%
COLLEGE, 1 YEAR OR MORE
0.0/ 100
METRIC RATING
295th/ 347
METRIC RANK
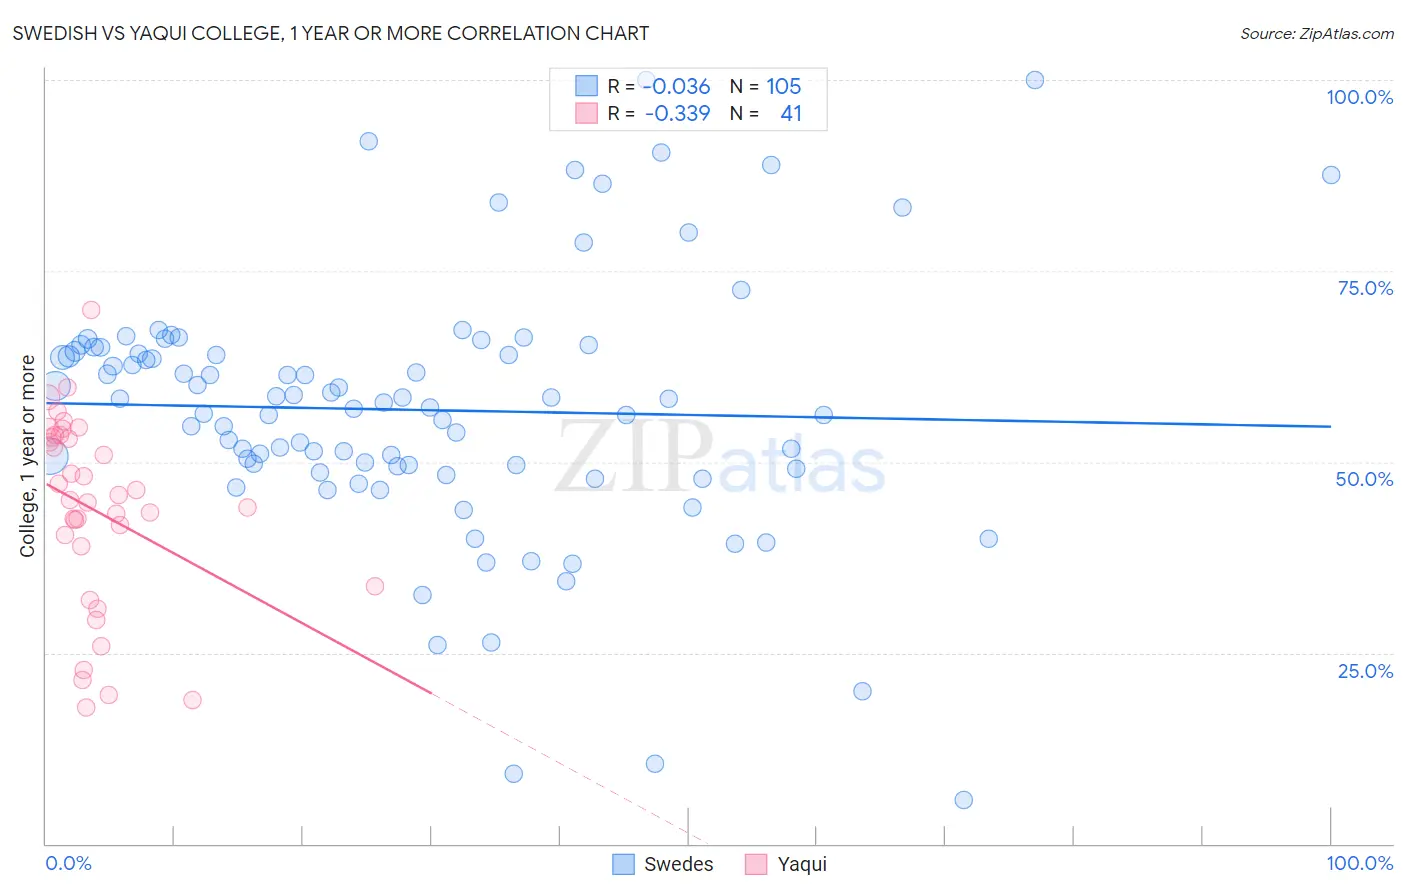
Swedish vs Yaqui College, 1 year or more Correlation Chart
The statistical analysis conducted on geographies consisting of 539,224,370 people shows no correlation between the proportion of Swedes and percentage of population with at least college, 1 year or more education in the United States with a correlation coefficient (R) of -0.036 and weighted average of 62.1%. Similarly, the statistical analysis conducted on geographies consisting of 107,738,640 people shows a mild negative correlation between the proportion of Yaqui and percentage of population with at least college, 1 year or more education in the United States with a correlation coefficient (R) of -0.339 and weighted average of 53.2%, a difference of 16.8%.
College, 1 year or more Correlation Summary
| Measurement | Swedish | Yaqui |
| Minimum | 5.7% | 17.9% |
| Maximum | 100.0% | 69.9% |
| Range | 94.3% | 52.0% |
| Mean | 56.8% | 43.6% |
| Median | 57.8% | 45.0% |
| Interquartile 25% (IQ1) | 49.2% | 36.3% |
| Interquartile 75% (IQ3) | 64.7% | 53.3% |
| Interquartile Range (IQR) | 15.5% | 17.0% |
| Standard Deviation (Sample) | 16.9% | 12.5% |
| Standard Deviation (Population) | 16.9% | 12.3% |
Similar Demographics by College, 1 year or more
Demographics Similar to Swedes by College, 1 year or more
In terms of college, 1 year or more, the demographic groups most similar to Swedes are Icelander (62.1%, a difference of 0.0%), Luxembourger (62.1%, a difference of 0.020%), Afghan (62.0%, a difference of 0.13%), Chilean (62.0%, a difference of 0.14%), and Immigrants from Nepal (62.0%, a difference of 0.16%).
| Demographics | Rating | Rank | College, 1 year or more |
| Immigrants | Croatia | 97.6 /100 | #94 | Exceptional 62.3% |
| British | 97.4 /100 | #95 | Exceptional 62.3% |
| Chinese | 97.2 /100 | #96 | Exceptional 62.2% |
| Jordanians | 97.2 /100 | #97 | Exceptional 62.2% |
| Carpatho Rusyns | 97.2 /100 | #98 | Exceptional 62.2% |
| Croatians | 97.1 /100 | #99 | Exceptional 62.2% |
| Icelanders | 96.8 /100 | #100 | Exceptional 62.1% |
| Swedes | 96.8 /100 | #101 | Exceptional 62.1% |
| Luxembourgers | 96.7 /100 | #102 | Exceptional 62.1% |
| Afghans | 96.4 /100 | #103 | Exceptional 62.0% |
| Chileans | 96.4 /100 | #104 | Exceptional 62.0% |
| Immigrants | Nepal | 96.3 /100 | #105 | Exceptional 62.0% |
| Palestinians | 96.3 /100 | #106 | Exceptional 62.0% |
| Immigrants | Ukraine | 95.8 /100 | #107 | Exceptional 61.9% |
| Syrians | 95.7 /100 | #108 | Exceptional 61.9% |
Demographics Similar to Yaqui by College, 1 year or more
In terms of college, 1 year or more, the demographic groups most similar to Yaqui are Cherokee (53.2%, a difference of 0.010%), Black/African American (53.3%, a difference of 0.23%), Chickasaw (53.3%, a difference of 0.25%), Sioux (53.0%, a difference of 0.34%), and Cuban (53.4%, a difference of 0.38%).
| Demographics | Rating | Rank | College, 1 year or more |
| Alaska Natives | 0.0 /100 | #288 | Tragic 53.4% |
| Immigrants | Ecuador | 0.0 /100 | #289 | Tragic 53.4% |
| Alaskan Athabascans | 0.0 /100 | #290 | Tragic 53.4% |
| Cubans | 0.0 /100 | #291 | Tragic 53.4% |
| Chickasaw | 0.0 /100 | #292 | Tragic 53.3% |
| Blacks/African Americans | 0.0 /100 | #293 | Tragic 53.3% |
| Cherokee | 0.0 /100 | #294 | Tragic 53.2% |
| Yaqui | 0.0 /100 | #295 | Tragic 53.2% |
| Sioux | 0.0 /100 | #296 | Tragic 53.0% |
| Paiute | 0.0 /100 | #297 | Tragic 52.9% |
| Immigrants | Dominica | 0.0 /100 | #298 | Tragic 52.5% |
| Immigrants | Nicaragua | 0.0 /100 | #299 | Tragic 52.4% |
| Choctaw | 0.0 /100 | #300 | Tragic 52.3% |
| Haitians | 0.0 /100 | #301 | Tragic 52.3% |
| Puerto Ricans | 0.0 /100 | #302 | Tragic 52.2% |