Swedish vs Inupiat College, 1 year or more
COMPARE
Swedish
Inupiat
College, 1 year or more
College, 1 year or more Comparison
Swedes
Inupiat
62.1%
COLLEGE, 1 YEAR OR MORE
96.8/ 100
METRIC RATING
101st/ 347
METRIC RANK
47.2%
COLLEGE, 1 YEAR OR MORE
0.0/ 100
METRIC RATING
342nd/ 347
METRIC RANK
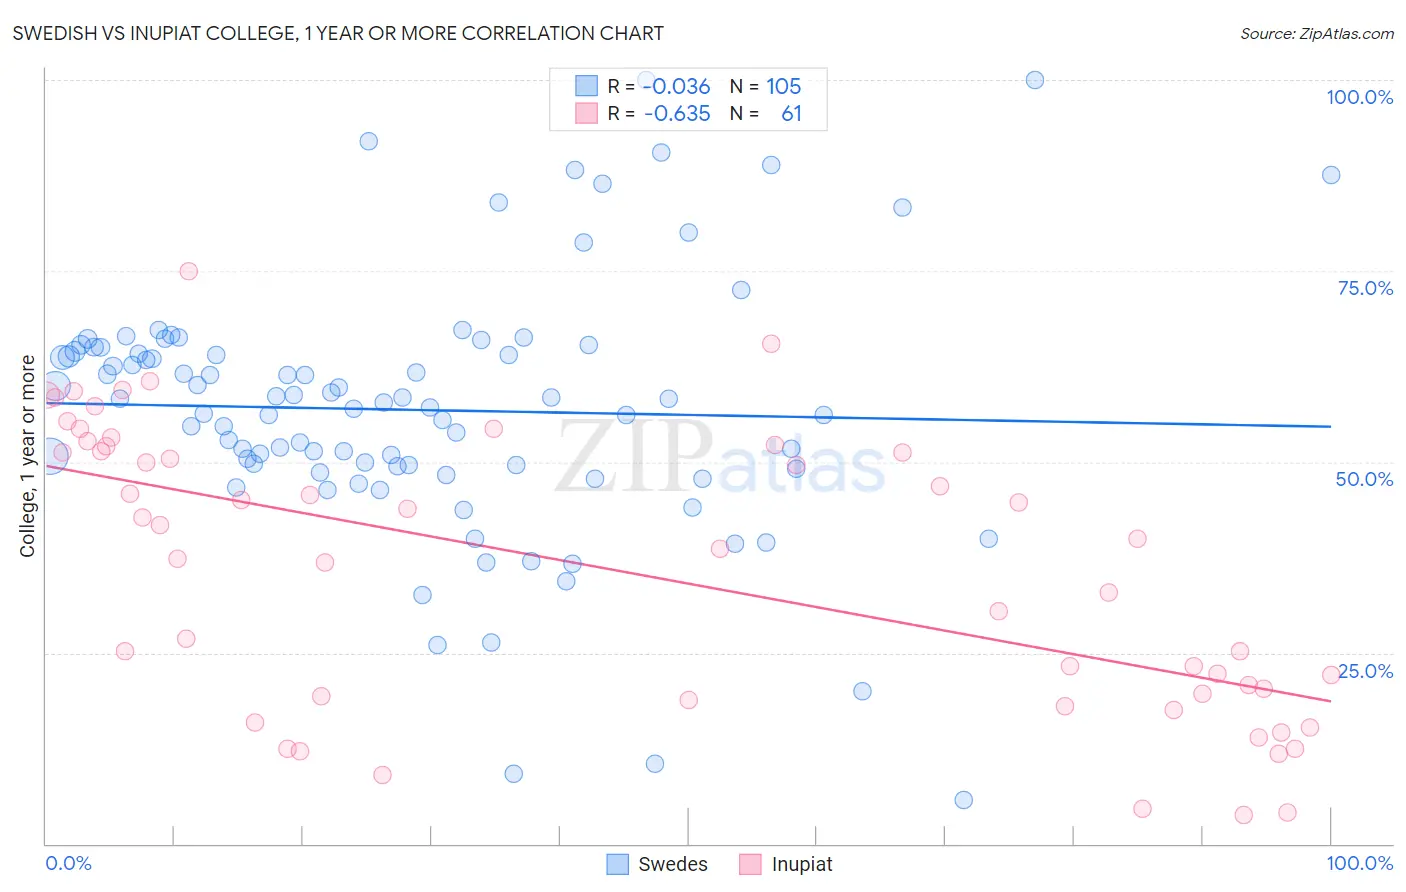
Swedish vs Inupiat College, 1 year or more Correlation Chart
The statistical analysis conducted on geographies consisting of 539,224,370 people shows no correlation between the proportion of Swedes and percentage of population with at least college, 1 year or more education in the United States with a correlation coefficient (R) of -0.036 and weighted average of 62.1%. Similarly, the statistical analysis conducted on geographies consisting of 96,349,094 people shows a significant negative correlation between the proportion of Inupiat and percentage of population with at least college, 1 year or more education in the United States with a correlation coefficient (R) of -0.635 and weighted average of 47.2%, a difference of 31.4%.
College, 1 year or more Correlation Summary
| Measurement | Swedish | Inupiat |
| Minimum | 5.7% | 3.8% |
| Maximum | 100.0% | 75.0% |
| Range | 94.3% | 71.2% |
| Mean | 56.8% | 35.7% |
| Median | 57.8% | 38.6% |
| Interquartile 25% (IQ1) | 49.2% | 19.1% |
| Interquartile 75% (IQ3) | 64.7% | 51.7% |
| Interquartile Range (IQR) | 15.5% | 32.7% |
| Standard Deviation (Sample) | 16.9% | 18.5% |
| Standard Deviation (Population) | 16.9% | 18.3% |
Similar Demographics by College, 1 year or more
Demographics Similar to Swedes by College, 1 year or more
In terms of college, 1 year or more, the demographic groups most similar to Swedes are Icelander (62.1%, a difference of 0.0%), Luxembourger (62.1%, a difference of 0.020%), Afghan (62.0%, a difference of 0.13%), Chilean (62.0%, a difference of 0.14%), and Immigrants from Nepal (62.0%, a difference of 0.16%).
| Demographics | Rating | Rank | College, 1 year or more |
| Immigrants | Croatia | 97.6 /100 | #94 | Exceptional 62.3% |
| British | 97.4 /100 | #95 | Exceptional 62.3% |
| Chinese | 97.2 /100 | #96 | Exceptional 62.2% |
| Jordanians | 97.2 /100 | #97 | Exceptional 62.2% |
| Carpatho Rusyns | 97.2 /100 | #98 | Exceptional 62.2% |
| Croatians | 97.1 /100 | #99 | Exceptional 62.2% |
| Icelanders | 96.8 /100 | #100 | Exceptional 62.1% |
| Swedes | 96.8 /100 | #101 | Exceptional 62.1% |
| Luxembourgers | 96.7 /100 | #102 | Exceptional 62.1% |
| Afghans | 96.4 /100 | #103 | Exceptional 62.0% |
| Chileans | 96.4 /100 | #104 | Exceptional 62.0% |
| Immigrants | Nepal | 96.3 /100 | #105 | Exceptional 62.0% |
| Palestinians | 96.3 /100 | #106 | Exceptional 62.0% |
| Immigrants | Ukraine | 95.8 /100 | #107 | Exceptional 61.9% |
| Syrians | 95.7 /100 | #108 | Exceptional 61.9% |
Demographics Similar to Inupiat by College, 1 year or more
In terms of college, 1 year or more, the demographic groups most similar to Inupiat are Tohono O'odham (47.1%, a difference of 0.22%), Immigrants from Mexico (47.5%, a difference of 0.57%), Immigrants from Cabo Verde (48.1%, a difference of 1.8%), Yakama (46.2%, a difference of 2.2%), and Immigrants from the Azores (48.4%, a difference of 2.4%).
| Demographics | Rating | Rank | College, 1 year or more |
| Immigrants | Dominican Republic | 0.0 /100 | #333 | Tragic 49.1% |
| Lumbee | 0.0 /100 | #334 | Tragic 48.9% |
| Yuman | 0.0 /100 | #335 | Tragic 48.7% |
| Spanish American Indians | 0.0 /100 | #336 | Tragic 48.5% |
| Pennsylvania Germans | 0.0 /100 | #337 | Tragic 48.5% |
| Immigrants | Central America | 0.0 /100 | #338 | Tragic 48.5% |
| Immigrants | Azores | 0.0 /100 | #339 | Tragic 48.4% |
| Immigrants | Cabo Verde | 0.0 /100 | #340 | Tragic 48.1% |
| Immigrants | Mexico | 0.0 /100 | #341 | Tragic 47.5% |
| Inupiat | 0.0 /100 | #342 | Tragic 47.2% |
| Tohono O'odham | 0.0 /100 | #343 | Tragic 47.1% |
| Yakama | 0.0 /100 | #344 | Tragic 46.2% |
| Pima | 0.0 /100 | #345 | Tragic 45.6% |
| Houma | 0.0 /100 | #346 | Tragic 41.2% |
| Yup'ik | 0.0 /100 | #347 | Tragic 39.4% |