Swedish vs Immigrants from Cabo Verde Female Unemployment
COMPARE
Swedish
Immigrants from Cabo Verde
Female Unemployment
Female Unemployment Comparison
Swedes
Immigrants from Cabo Verde
4.4%
FEMALE UNEMPLOYMENT
100.0/ 100
METRIC RATING
6th/ 347
METRIC RANK
6.1%
FEMALE UNEMPLOYMENT
0.0/ 100
METRIC RATING
285th/ 347
METRIC RANK
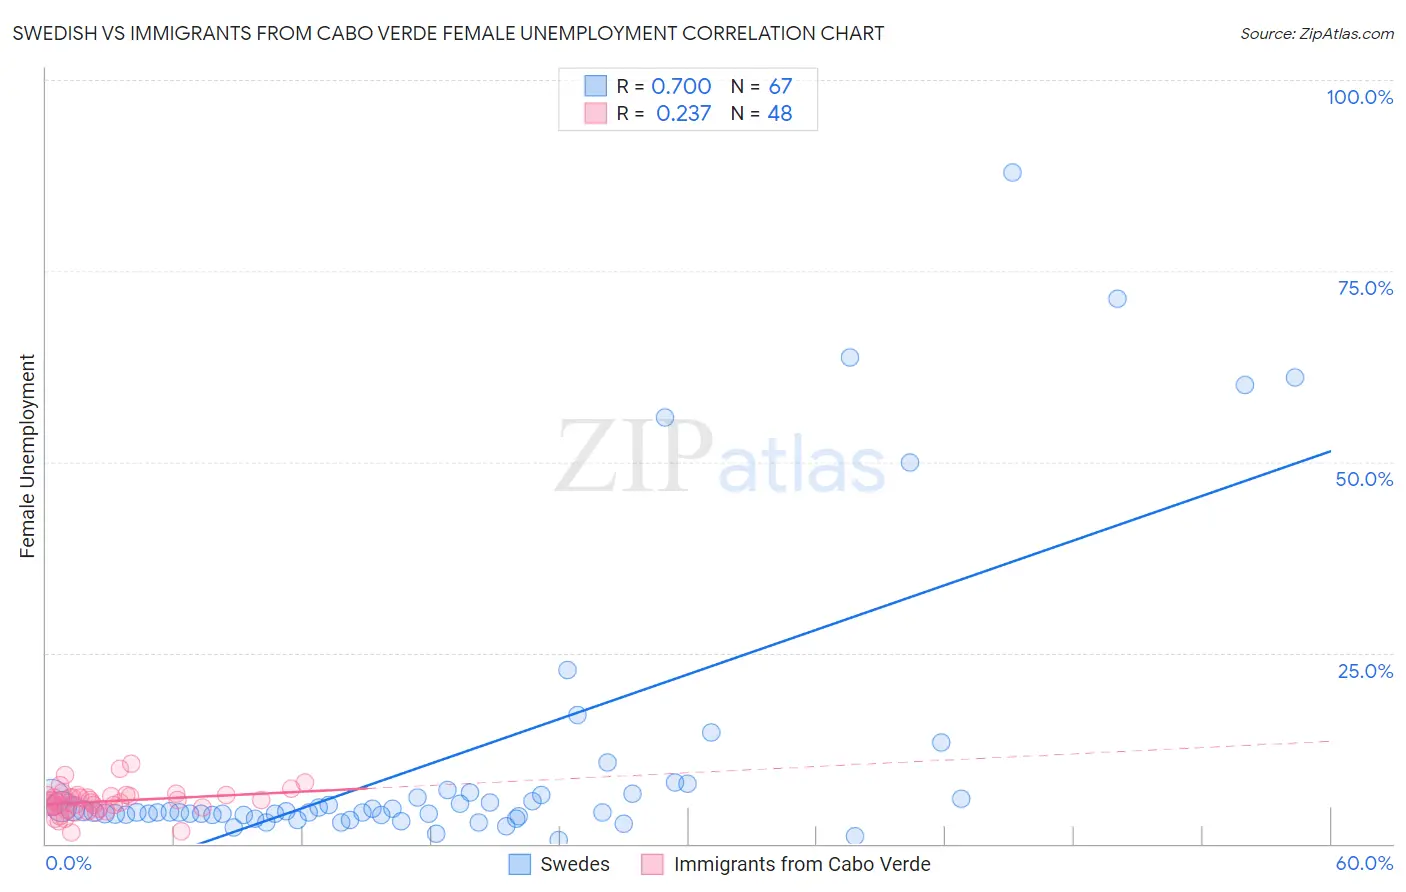
Swedish vs Immigrants from Cabo Verde Female Unemployment Correlation Chart
The statistical analysis conducted on geographies consisting of 528,532,486 people shows a strong positive correlation between the proportion of Swedes and unemploymnet rate among females in the United States with a correlation coefficient (R) of 0.700 and weighted average of 4.4%. Similarly, the statistical analysis conducted on geographies consisting of 38,081,993 people shows a weak positive correlation between the proportion of Immigrants from Cabo Verde and unemploymnet rate among females in the United States with a correlation coefficient (R) of 0.237 and weighted average of 6.1%, a difference of 36.7%.
Female Unemployment Correlation Summary
| Measurement | Swedish | Immigrants from Cabo Verde |
| Minimum | 0.50% | 1.5% |
| Maximum | 87.9% | 10.5% |
| Range | 87.4% | 9.0% |
| Mean | 11.3% | 5.5% |
| Median | 4.2% | 5.6% |
| Interquartile 25% (IQ1) | 3.7% | 4.7% |
| Interquartile 75% (IQ3) | 6.5% | 6.2% |
| Interquartile Range (IQR) | 2.8% | 1.6% |
| Standard Deviation (Sample) | 18.9% | 1.7% |
| Standard Deviation (Population) | 18.8% | 1.7% |
Similar Demographics by Female Unemployment
Demographics Similar to Swedes by Female Unemployment
In terms of female unemployment, the demographic groups most similar to Swedes are Chinese (4.5%, a difference of 0.77%), German (4.5%, a difference of 0.79%), Slovene (4.5%, a difference of 1.1%), Hmong (4.4%, a difference of 1.2%), and Danish (4.4%, a difference of 1.3%).
| Demographics | Rating | Rank | Female Unemployment |
| Norwegians | 100.0 /100 | #1 | Exceptional 4.2% |
| Czechs | 100.0 /100 | #2 | Exceptional 4.4% |
| Luxembourgers | 100.0 /100 | #3 | Exceptional 4.4% |
| Danes | 100.0 /100 | #4 | Exceptional 4.4% |
| Hmong | 100.0 /100 | #5 | Exceptional 4.4% |
| Swedes | 100.0 /100 | #6 | Exceptional 4.4% |
| Chinese | 100.0 /100 | #7 | Exceptional 4.5% |
| Germans | 100.0 /100 | #8 | Exceptional 4.5% |
| Slovenes | 100.0 /100 | #9 | Exceptional 4.5% |
| Swiss | 100.0 /100 | #10 | Exceptional 4.6% |
| Scandinavians | 100.0 /100 | #11 | Exceptional 4.6% |
| Dutch | 100.0 /100 | #12 | Exceptional 4.6% |
| Belgians | 100.0 /100 | #13 | Exceptional 4.6% |
| Finns | 100.0 /100 | #14 | Exceptional 4.6% |
| English | 100.0 /100 | #15 | Exceptional 4.6% |
Demographics Similar to Immigrants from Cabo Verde by Female Unemployment
In terms of female unemployment, the demographic groups most similar to Immigrants from Cabo Verde are Chippewa (6.1%, a difference of 0.030%), Immigrants from Guatemala (6.1%, a difference of 0.050%), Haitian (6.1%, a difference of 0.10%), Trinidadian and Tobagonian (6.1%, a difference of 0.11%), and Immigrants from Caribbean (6.1%, a difference of 0.17%).
| Demographics | Rating | Rank | Female Unemployment |
| Yaqui | 0.0 /100 | #278 | Tragic 6.0% |
| Armenians | 0.0 /100 | #279 | Tragic 6.0% |
| Mexican American Indians | 0.0 /100 | #280 | Tragic 6.0% |
| Guatemalans | 0.0 /100 | #281 | Tragic 6.0% |
| Colville | 0.0 /100 | #282 | Tragic 6.0% |
| Salvadorans | 0.0 /100 | #283 | Tragic 6.0% |
| Immigrants | Senegal | 0.0 /100 | #284 | Tragic 6.1% |
| Immigrants | Cabo Verde | 0.0 /100 | #285 | Tragic 6.1% |
| Chippewa | 0.0 /100 | #286 | Tragic 6.1% |
| Immigrants | Guatemala | 0.0 /100 | #287 | Tragic 6.1% |
| Haitians | 0.0 /100 | #288 | Tragic 6.1% |
| Trinidadians and Tobagonians | 0.0 /100 | #289 | Tragic 6.1% |
| Immigrants | Caribbean | 0.0 /100 | #290 | Tragic 6.1% |
| Immigrants | West Indies | 0.0 /100 | #291 | Tragic 6.1% |
| Immigrants | Trinidad and Tobago | 0.0 /100 | #292 | Tragic 6.1% |