Swedish vs Central American Associate's Degree
COMPARE
Swedish
Central American
Associate's Degree
Associate's Degree Comparison
Swedes
Central Americans
48.4%
ASSOCIATE'S DEGREE
91.5/ 100
METRIC RATING
129th/ 347
METRIC RANK
39.4%
ASSOCIATE'S DEGREE
0.0/ 100
METRIC RATING
289th/ 347
METRIC RANK
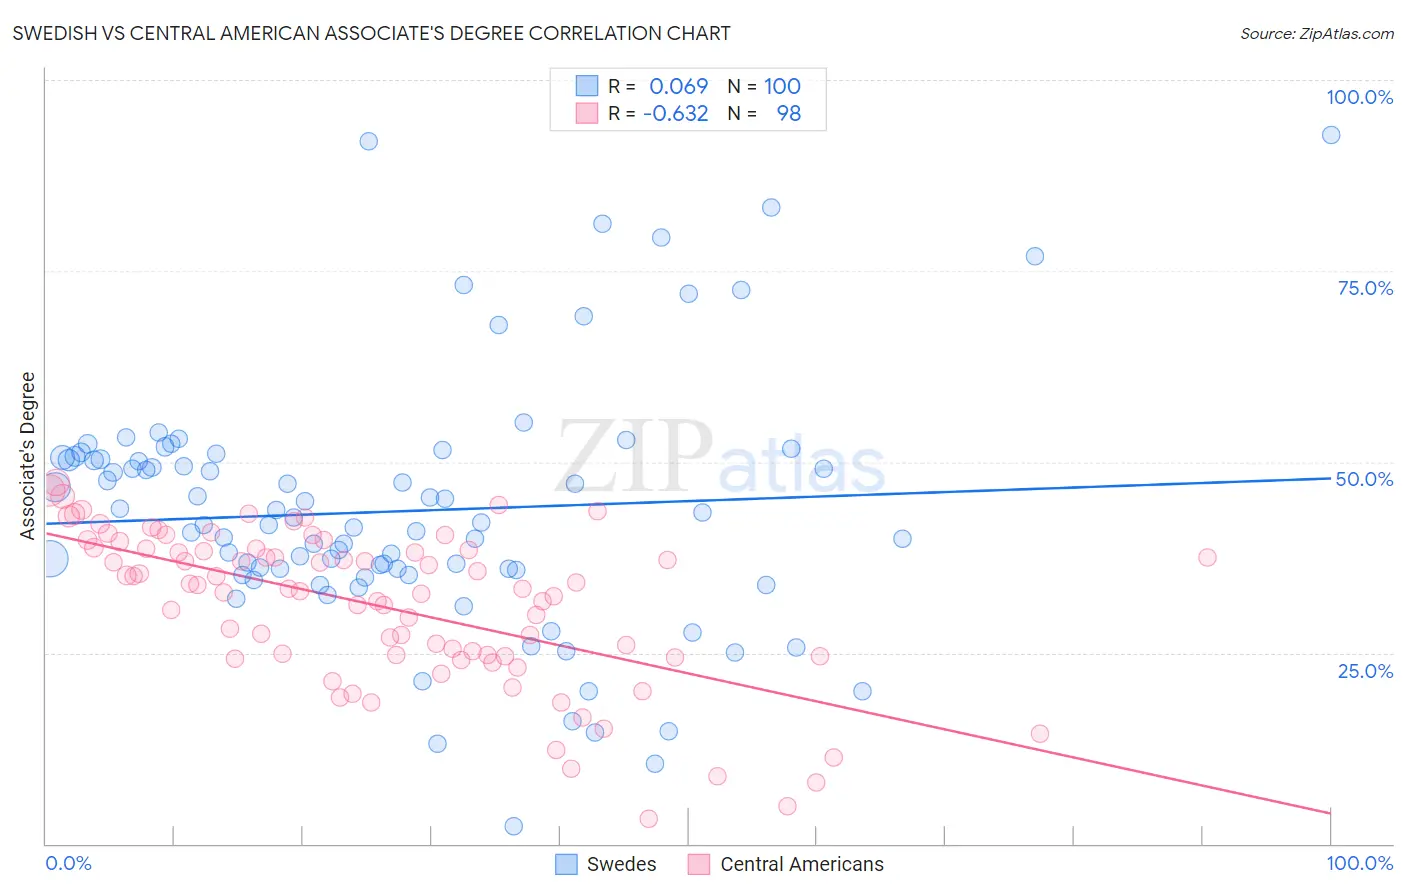
Swedish vs Central American Associate's Degree Correlation Chart
The statistical analysis conducted on geographies consisting of 539,194,795 people shows a slight positive correlation between the proportion of Swedes and percentage of population with at least associate's degree education in the United States with a correlation coefficient (R) of 0.069 and weighted average of 48.4%. Similarly, the statistical analysis conducted on geographies consisting of 504,559,402 people shows a significant negative correlation between the proportion of Central Americans and percentage of population with at least associate's degree education in the United States with a correlation coefficient (R) of -0.632 and weighted average of 39.4%, a difference of 22.8%.
Associate's Degree Correlation Summary
| Measurement | Swedish | Central American |
| Minimum | 2.3% | 3.3% |
| Maximum | 92.9% | 47.4% |
| Range | 90.6% | 44.0% |
| Mean | 43.5% | 31.1% |
| Median | 41.9% | 33.4% |
| Interquartile 25% (IQ1) | 35.6% | 24.6% |
| Interquartile 75% (IQ3) | 50.4% | 38.6% |
| Interquartile Range (IQR) | 14.9% | 14.0% |
| Standard Deviation (Sample) | 16.5% | 10.1% |
| Standard Deviation (Population) | 16.4% | 10.0% |
Similar Demographics by Associate's Degree
Demographics Similar to Swedes by Associate's Degree
In terms of associate's degree, the demographic groups most similar to Swedes are Immigrants from Eastern Africa (48.4%, a difference of 0.030%), Immigrants from Jordan (48.4%, a difference of 0.060%), Immigrants from Uganda (48.5%, a difference of 0.15%), Immigrants from Syria (48.5%, a difference of 0.16%), and Icelander (48.3%, a difference of 0.16%).
| Demographics | Rating | Rank | Associate's Degree |
| Italians | 93.9 /100 | #122 | Exceptional 48.7% |
| Brazilians | 93.7 /100 | #123 | Exceptional 48.7% |
| Serbians | 92.6 /100 | #124 | Exceptional 48.5% |
| Chinese | 92.5 /100 | #125 | Exceptional 48.5% |
| Immigrants | Syria | 92.2 /100 | #126 | Exceptional 48.5% |
| Immigrants | Uganda | 92.1 /100 | #127 | Exceptional 48.5% |
| Immigrants | Eastern Africa | 91.6 /100 | #128 | Exceptional 48.4% |
| Swedes | 91.5 /100 | #129 | Exceptional 48.4% |
| Immigrants | Jordan | 91.2 /100 | #130 | Exceptional 48.4% |
| Icelanders | 90.8 /100 | #131 | Exceptional 48.3% |
| Immigrants | Albania | 89.9 /100 | #132 | Excellent 48.2% |
| Assyrians/Chaldeans/Syriacs | 89.4 /100 | #133 | Excellent 48.2% |
| Moroccans | 89.3 /100 | #134 | Excellent 48.2% |
| Europeans | 89.0 /100 | #135 | Excellent 48.2% |
| Pakistanis | 88.0 /100 | #136 | Excellent 48.1% |
Demographics Similar to Central Americans by Associate's Degree
In terms of associate's degree, the demographic groups most similar to Central Americans are Immigrants from Cuba (39.5%, a difference of 0.26%), Immigrants from Haiti (39.3%, a difference of 0.44%), Dominican (39.3%, a difference of 0.46%), Aleut (39.6%, a difference of 0.50%), and Black/African American (39.1%, a difference of 0.75%).
| Demographics | Rating | Rank | Associate's Degree |
| Bangladeshis | 0.1 /100 | #282 | Tragic 40.0% |
| Haitians | 0.1 /100 | #283 | Tragic 40.0% |
| Comanche | 0.1 /100 | #284 | Tragic 39.9% |
| Immigrants | Belize | 0.1 /100 | #285 | Tragic 39.9% |
| Immigrants | Caribbean | 0.0 /100 | #286 | Tragic 39.7% |
| Aleuts | 0.0 /100 | #287 | Tragic 39.6% |
| Immigrants | Cuba | 0.0 /100 | #288 | Tragic 39.5% |
| Central Americans | 0.0 /100 | #289 | Tragic 39.4% |
| Immigrants | Haiti | 0.0 /100 | #290 | Tragic 39.3% |
| Dominicans | 0.0 /100 | #291 | Tragic 39.3% |
| Blacks/African Americans | 0.0 /100 | #292 | Tragic 39.1% |
| Nepalese | 0.0 /100 | #293 | Tragic 39.0% |
| Salvadorans | 0.0 /100 | #294 | Tragic 39.0% |
| Hondurans | 0.0 /100 | #295 | Tragic 38.9% |
| Cherokee | 0.0 /100 | #296 | Tragic 38.9% |