Immigrants from St. Vincent and the Grenadines vs Lumbee 12th Grade, No Diploma
COMPARE
Immigrants from St. Vincent and the Grenadines
Lumbee
12th Grade, No Diploma
12th Grade, No Diploma Comparison
Immigrants from St. Vincent and the Grenadines
Lumbee
88.9%
12TH GRADE, NO DIPLOMA
0.0/ 100
METRIC RATING
278th/ 347
METRIC RANK
85.7%
12TH GRADE, NO DIPLOMA
0.0/ 100
METRIC RATING
327th/ 347
METRIC RANK
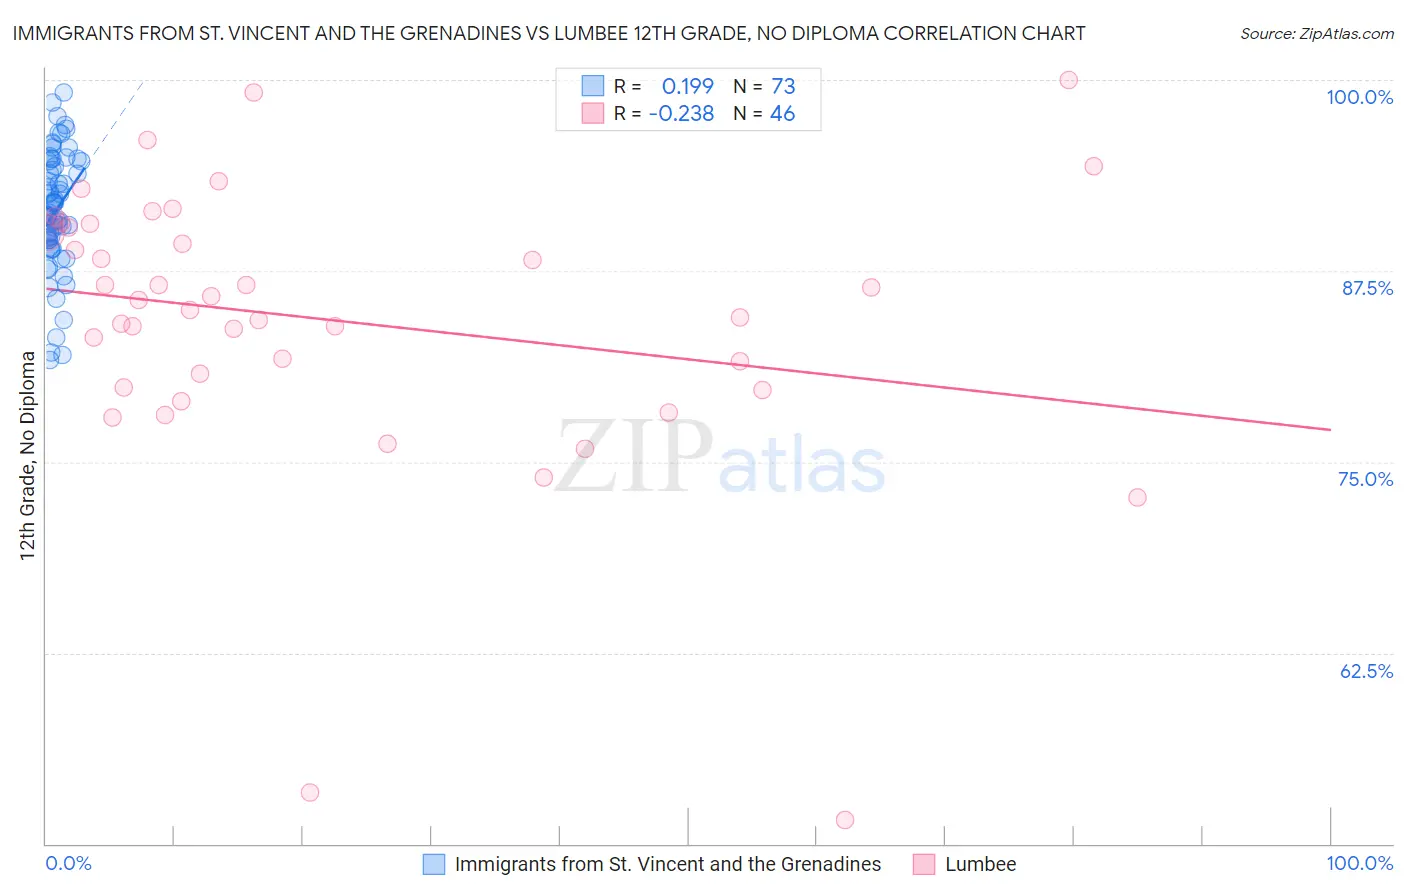
Immigrants from St. Vincent and the Grenadines vs Lumbee 12th Grade, No Diploma Correlation Chart
The statistical analysis conducted on geographies consisting of 56,191,418 people shows a poor positive correlation between the proportion of Immigrants from St. Vincent and the Grenadines and percentage of population with at least 12th grade (no diploma) education in the United States with a correlation coefficient (R) of 0.199 and weighted average of 88.9%. Similarly, the statistical analysis conducted on geographies consisting of 92,299,068 people shows a weak negative correlation between the proportion of Lumbee and percentage of population with at least 12th grade (no diploma) education in the United States with a correlation coefficient (R) of -0.238 and weighted average of 85.7%, a difference of 3.8%.
12th Grade, No Diploma Correlation Summary
| Measurement | Immigrants from St. Vincent and the Grenadines | Lumbee |
| Minimum | 81.7% | 51.6% |
| Maximum | 99.2% | 100.0% |
| Range | 17.5% | 48.4% |
| Mean | 91.4% | 84.3% |
| Median | 91.1% | 85.3% |
| Interquartile 25% (IQ1) | 89.5% | 79.8% |
| Interquartile 75% (IQ3) | 94.5% | 90.3% |
| Interquartile Range (IQR) | 5.0% | 10.5% |
| Standard Deviation (Sample) | 3.8% | 9.3% |
| Standard Deviation (Population) | 3.8% | 9.2% |
Similar Demographics by 12th Grade, No Diploma
Demographics Similar to Immigrants from St. Vincent and the Grenadines by 12th Grade, No Diploma
In terms of 12th grade, no diploma, the demographic groups most similar to Immigrants from St. Vincent and the Grenadines are Immigrants from Barbados (89.0%, a difference of 0.060%), Immigrants from Laos (88.9%, a difference of 0.070%), Immigrants from Burma/Myanmar (88.9%, a difference of 0.070%), Cuban (88.9%, a difference of 0.080%), and Immigrants from Congo (89.0%, a difference of 0.12%).
| Demographics | Rating | Rank | 12th Grade, No Diploma |
| Blacks/African Americans | 0.1 /100 | #271 | Tragic 89.3% |
| Malaysians | 0.1 /100 | #272 | Tragic 89.2% |
| Barbadians | 0.1 /100 | #273 | Tragic 89.1% |
| Cajuns | 0.1 /100 | #274 | Tragic 89.1% |
| Immigrants | Congo | 0.1 /100 | #275 | Tragic 89.0% |
| Ute | 0.1 /100 | #276 | Tragic 89.0% |
| Immigrants | Barbados | 0.0 /100 | #277 | Tragic 89.0% |
| Immigrants | St. Vincent and the Grenadines | 0.0 /100 | #278 | Tragic 88.9% |
| Immigrants | Laos | 0.0 /100 | #279 | Tragic 88.9% |
| Immigrants | Burma/Myanmar | 0.0 /100 | #280 | Tragic 88.9% |
| Cubans | 0.0 /100 | #281 | Tragic 88.9% |
| Immigrants | Vietnam | 0.0 /100 | #282 | Tragic 88.7% |
| Paiute | 0.0 /100 | #283 | Tragic 88.7% |
| Pennsylvania Germans | 0.0 /100 | #284 | Tragic 88.7% |
| Indonesians | 0.0 /100 | #285 | Tragic 88.6% |
Demographics Similar to Lumbee by 12th Grade, No Diploma
In terms of 12th grade, no diploma, the demographic groups most similar to Lumbee are Dominican (85.7%, a difference of 0.010%), Mexican American Indian (85.7%, a difference of 0.030%), Immigrants from Cabo Verde (85.8%, a difference of 0.10%), Honduran (85.5%, a difference of 0.19%), and Hispanic or Latino (85.4%, a difference of 0.28%).
| Demographics | Rating | Rank | 12th Grade, No Diploma |
| Immigrants | Nicaragua | 0.0 /100 | #320 | Tragic 86.6% |
| Puerto Ricans | 0.0 /100 | #321 | Tragic 86.5% |
| Central American Indians | 0.0 /100 | #322 | Tragic 86.5% |
| Yuman | 0.0 /100 | #323 | Tragic 86.5% |
| Immigrants | Cabo Verde | 0.0 /100 | #324 | Tragic 85.8% |
| Mexican American Indians | 0.0 /100 | #325 | Tragic 85.7% |
| Dominicans | 0.0 /100 | #326 | Tragic 85.7% |
| Lumbee | 0.0 /100 | #327 | Tragic 85.7% |
| Hondurans | 0.0 /100 | #328 | Tragic 85.5% |
| Hispanics or Latinos | 0.0 /100 | #329 | Tragic 85.4% |
| Immigrants | Azores | 0.0 /100 | #330 | Tragic 85.3% |
| Central Americans | 0.0 /100 | #331 | Tragic 85.2% |
| Immigrants | Honduras | 0.0 /100 | #332 | Tragic 85.0% |
| Immigrants | Latin America | 0.0 /100 | #333 | Tragic 85.0% |
| Immigrants | Dominican Republic | 0.0 /100 | #334 | Tragic 84.9% |