Subsaharan African vs Immigrants from Poland 2nd Grade
COMPARE
Subsaharan African
Immigrants from Poland
2nd Grade
2nd Grade Comparison
Sub-Saharan Africans
Immigrants from Poland
97.6%
2ND GRADE
3.4/ 100
METRIC RATING
228th/ 347
METRIC RANK
97.8%
2ND GRADE
42.2/ 100
METRIC RATING
183rd/ 347
METRIC RANK
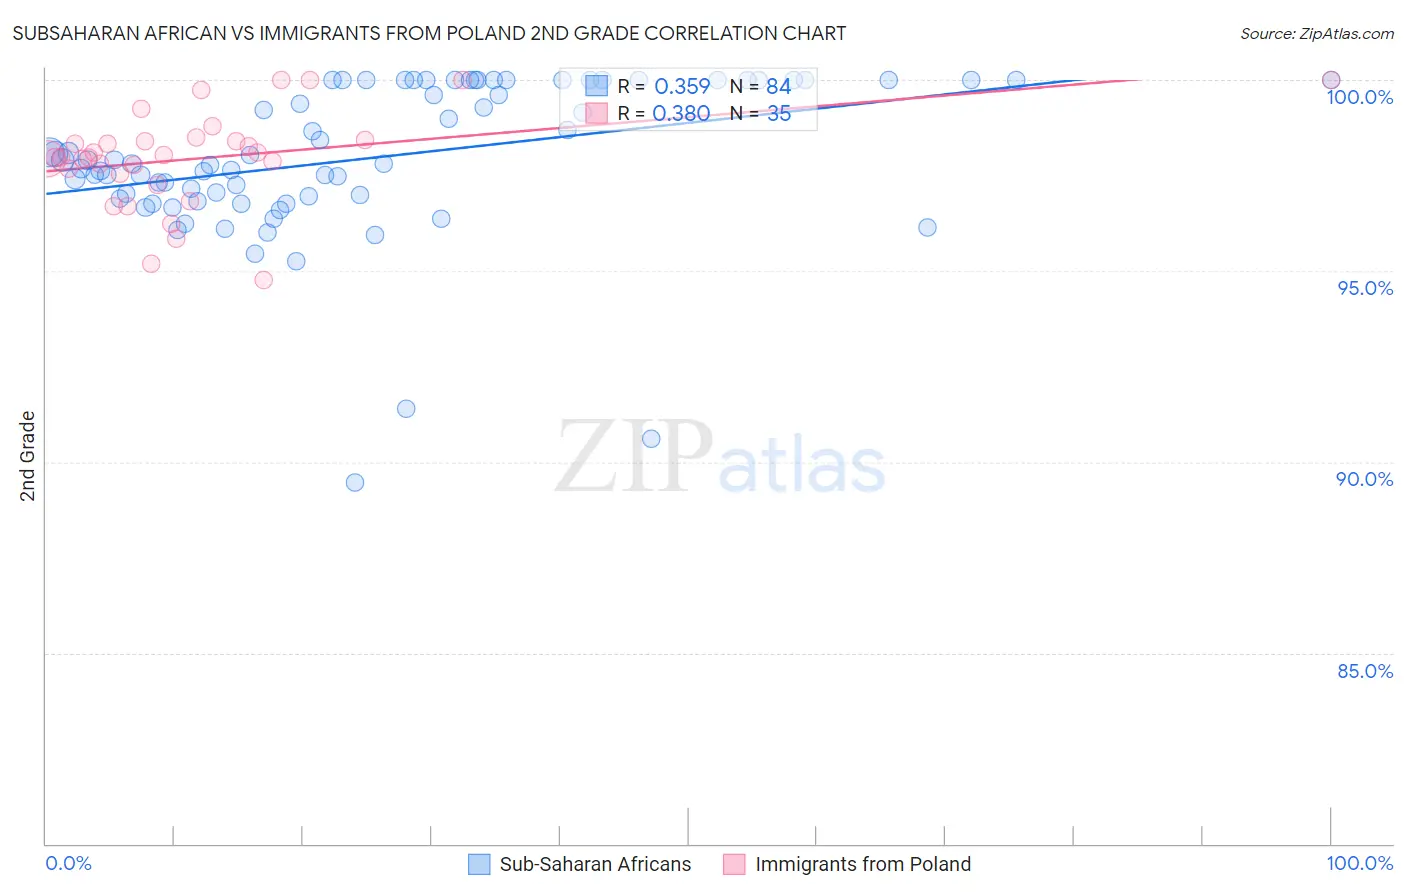
Subsaharan African vs Immigrants from Poland 2nd Grade Correlation Chart
The statistical analysis conducted on geographies consisting of 508,209,936 people shows a mild positive correlation between the proportion of Sub-Saharan Africans and percentage of population with at least 2nd grade education in the United States with a correlation coefficient (R) of 0.359 and weighted average of 97.6%. Similarly, the statistical analysis conducted on geographies consisting of 304,861,559 people shows a mild positive correlation between the proportion of Immigrants from Poland and percentage of population with at least 2nd grade education in the United States with a correlation coefficient (R) of 0.380 and weighted average of 97.8%, a difference of 0.24%.
2nd Grade Correlation Summary
| Measurement | Subsaharan African | Immigrants from Poland |
| Minimum | 89.5% | 94.8% |
| Maximum | 100.0% | 100.0% |
| Range | 10.5% | 5.2% |
| Mean | 98.0% | 98.0% |
| Median | 97.9% | 98.0% |
| Interquartile 25% (IQ1) | 96.9% | 97.5% |
| Interquartile 75% (IQ3) | 100.0% | 98.4% |
| Interquartile Range (IQR) | 3.1% | 0.89% |
| Standard Deviation (Sample) | 2.0% | 1.3% |
| Standard Deviation (Population) | 2.0% | 1.2% |
Similar Demographics by 2nd Grade
Demographics Similar to Sub-Saharan Africans by 2nd Grade
In terms of 2nd grade, the demographic groups most similar to Sub-Saharan Africans are Immigrants from Syria (97.6%, a difference of 0.010%), Immigrants from Nepal (97.6%, a difference of 0.010%), Immigrants from Costa Rica (97.6%, a difference of 0.010%), Senegalese (97.6%, a difference of 0.010%), and Iraqi (97.6%, a difference of 0.020%).
| Demographics | Rating | Rank | 2nd Grade |
| Iraqis | 4.6 /100 | #221 | Tragic 97.6% |
| Immigrants | Sudan | 4.5 /100 | #222 | Tragic 97.6% |
| Sierra Leoneans | 4.3 /100 | #223 | Tragic 97.6% |
| Immigrants | Zaire | 4.3 /100 | #224 | Tragic 97.6% |
| Tongans | 4.3 /100 | #225 | Tragic 97.6% |
| Immigrants | Syria | 4.0 /100 | #226 | Tragic 97.6% |
| Immigrants | Nepal | 4.0 /100 | #227 | Tragic 97.6% |
| Sub-Saharan Africans | 3.4 /100 | #228 | Tragic 97.6% |
| Immigrants | Costa Rica | 3.1 /100 | #229 | Tragic 97.6% |
| Senegalese | 3.1 /100 | #230 | Tragic 97.6% |
| Immigrants | Pakistan | 2.3 /100 | #231 | Tragic 97.6% |
| Immigrants | Western Asia | 2.1 /100 | #232 | Tragic 97.6% |
| Immigrants | Uruguay | 2.1 /100 | #233 | Tragic 97.6% |
| Immigrants | Malaysia | 2.0 /100 | #234 | Tragic 97.6% |
| Colombians | 1.9 /100 | #235 | Tragic 97.6% |
Demographics Similar to Immigrants from Poland by 2nd Grade
In terms of 2nd grade, the demographic groups most similar to Immigrants from Poland are Portuguese (97.8%, a difference of 0.0%), Immigrants from Belarus (97.8%, a difference of 0.0%), Immigrants from Brazil (97.9%, a difference of 0.010%), Argentinean (97.9%, a difference of 0.010%), and Immigrants from Venezuela (97.9%, a difference of 0.010%).
| Demographics | Rating | Rank | 2nd Grade |
| Immigrants | Sri Lanka | 48.7 /100 | #176 | Average 97.9% |
| Immigrants | Brazil | 46.6 /100 | #177 | Average 97.9% |
| Argentineans | 46.3 /100 | #178 | Average 97.9% |
| Immigrants | Venezuela | 46.1 /100 | #179 | Average 97.9% |
| Natives/Alaskans | 44.3 /100 | #180 | Average 97.9% |
| Egyptians | 44.3 /100 | #181 | Average 97.9% |
| Portuguese | 42.4 /100 | #182 | Average 97.8% |
| Immigrants | Poland | 42.2 /100 | #183 | Average 97.8% |
| Immigrants | Belarus | 41.5 /100 | #184 | Average 97.8% |
| Immigrants | Argentina | 40.6 /100 | #185 | Average 97.8% |
| Arabs | 36.9 /100 | #186 | Fair 97.8% |
| Pakistanis | 36.1 /100 | #187 | Fair 97.8% |
| Immigrants | Kazakhstan | 35.6 /100 | #188 | Fair 97.8% |
| Panamanians | 33.5 /100 | #189 | Fair 97.8% |
| Immigrants | Taiwan | 31.8 /100 | #190 | Fair 97.8% |