Subsaharan African vs Aleut No Schooling Completed
COMPARE
Subsaharan African
Aleut
No Schooling Completed
No Schooling Completed Comparison
Sub-Saharan Africans
Aleuts
2.3%
NO SCHOOLING COMPLETED
4.7/ 100
METRIC RATING
222nd/ 347
METRIC RANK
1.6%
NO SCHOOLING COMPLETED
99.9/ 100
METRIC RATING
36th/ 347
METRIC RANK
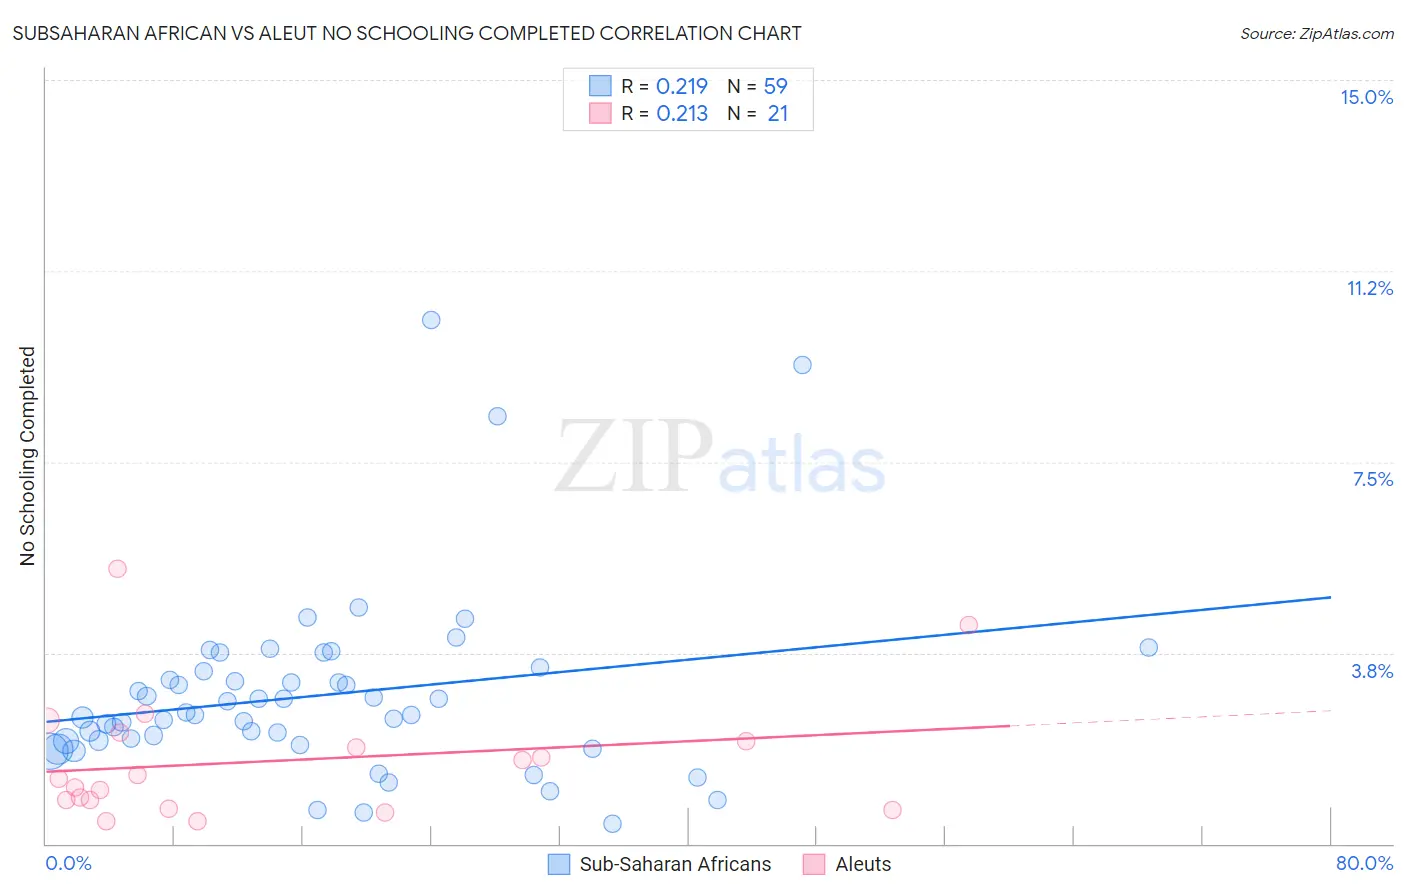
Subsaharan African vs Aleut No Schooling Completed Correlation Chart
The statistical analysis conducted on geographies consisting of 500,622,971 people shows a weak positive correlation between the proportion of Sub-Saharan Africans and percentage of population with no schooling in the United States with a correlation coefficient (R) of 0.219 and weighted average of 2.3%. Similarly, the statistical analysis conducted on geographies consisting of 61,492,558 people shows a weak positive correlation between the proportion of Aleuts and percentage of population with no schooling in the United States with a correlation coefficient (R) of 0.213 and weighted average of 1.6%, a difference of 46.4%.
No Schooling Completed Correlation Summary
| Measurement | Subsaharan African | Aleut |
| Minimum | 0.39% | 0.44% |
| Maximum | 10.3% | 5.4% |
| Range | 9.9% | 5.0% |
| Mean | 2.9% | 1.6% |
| Median | 2.5% | 1.3% |
| Interquartile 25% (IQ1) | 2.0% | 0.76% |
| Interquartile 75% (IQ3) | 3.4% | 2.1% |
| Interquartile Range (IQR) | 1.4% | 1.3% |
| Standard Deviation (Sample) | 1.8% | 1.3% |
| Standard Deviation (Population) | 1.8% | 1.2% |
Similar Demographics by No Schooling Completed
Demographics Similar to Sub-Saharan Africans by No Schooling Completed
In terms of no schooling completed, the demographic groups most similar to Sub-Saharan Africans are Immigrants from Lebanon (2.3%, a difference of 0.15%), Immigrants from Sudan (2.3%, a difference of 0.17%), Immigrants from Costa Rica (2.3%, a difference of 0.26%), Tohono O'odham (2.3%, a difference of 0.44%), and Sudanese (2.3%, a difference of 0.44%).
| Demographics | Rating | Rank | No Schooling Completed |
| Immigrants | Zaire | 7.2 /100 | #215 | Tragic 2.3% |
| Tongans | 6.8 /100 | #216 | Tragic 2.3% |
| Immigrants | Syria | 6.6 /100 | #217 | Tragic 2.3% |
| Immigrants | Nepal | 6.4 /100 | #218 | Tragic 2.3% |
| Senegalese | 5.6 /100 | #219 | Tragic 2.3% |
| Immigrants | Costa Rica | 5.1 /100 | #220 | Tragic 2.3% |
| Immigrants | Sudan | 5.0 /100 | #221 | Tragic 2.3% |
| Sub-Saharan Africans | 4.7 /100 | #222 | Tragic 2.3% |
| Immigrants | Lebanon | 4.5 /100 | #223 | Tragic 2.3% |
| Tohono O'odham | 4.1 /100 | #224 | Tragic 2.3% |
| Sudanese | 4.1 /100 | #225 | Tragic 2.3% |
| Sierra Leoneans | 4.1 /100 | #226 | Tragic 2.3% |
| Immigrants | Uganda | 4.0 /100 | #227 | Tragic 2.3% |
| U.S. Virgin Islanders | 3.7 /100 | #228 | Tragic 2.3% |
| Immigrants | Pakistan | 3.6 /100 | #229 | Tragic 2.3% |
Demographics Similar to Aleuts by No Schooling Completed
In terms of no schooling completed, the demographic groups most similar to Aleuts are Belgian (1.6%, a difference of 0.27%), Northern European (1.6%, a difference of 0.40%), Native Hawaiian (1.6%, a difference of 0.67%), Eastern European (1.6%, a difference of 1.0%), and Luxembourger (1.6%, a difference of 1.0%).
| Demographics | Rating | Rank | No Schooling Completed |
| Lumbee | 100.0 /100 | #29 | Exceptional 1.5% |
| British | 100.0 /100 | #30 | Exceptional 1.5% |
| Inupiat | 100.0 /100 | #31 | Exceptional 1.5% |
| Swiss | 100.0 /100 | #32 | Exceptional 1.5% |
| Italians | 100.0 /100 | #33 | Exceptional 1.5% |
| Latvians | 100.0 /100 | #34 | Exceptional 1.5% |
| Eastern Europeans | 100.0 /100 | #35 | Exceptional 1.6% |
| Aleuts | 99.9 /100 | #36 | Exceptional 1.6% |
| Belgians | 99.9 /100 | #37 | Exceptional 1.6% |
| Northern Europeans | 99.9 /100 | #38 | Exceptional 1.6% |
| Native Hawaiians | 99.9 /100 | #39 | Exceptional 1.6% |
| Luxembourgers | 99.9 /100 | #40 | Exceptional 1.6% |
| Hungarians | 99.9 /100 | #41 | Exceptional 1.6% |
| Bulgarians | 99.9 /100 | #42 | Exceptional 1.6% |
| Australians | 99.9 /100 | #43 | Exceptional 1.6% |