Subsaharan African vs West Indian No Schooling Completed
COMPARE
Subsaharan African
West Indian
No Schooling Completed
No Schooling Completed Comparison
Sub-Saharan Africans
West Indians
2.3%
NO SCHOOLING COMPLETED
4.7/ 100
METRIC RATING
222nd/ 347
METRIC RANK
2.5%
NO SCHOOLING COMPLETED
0.4/ 100
METRIC RATING
265th/ 347
METRIC RANK
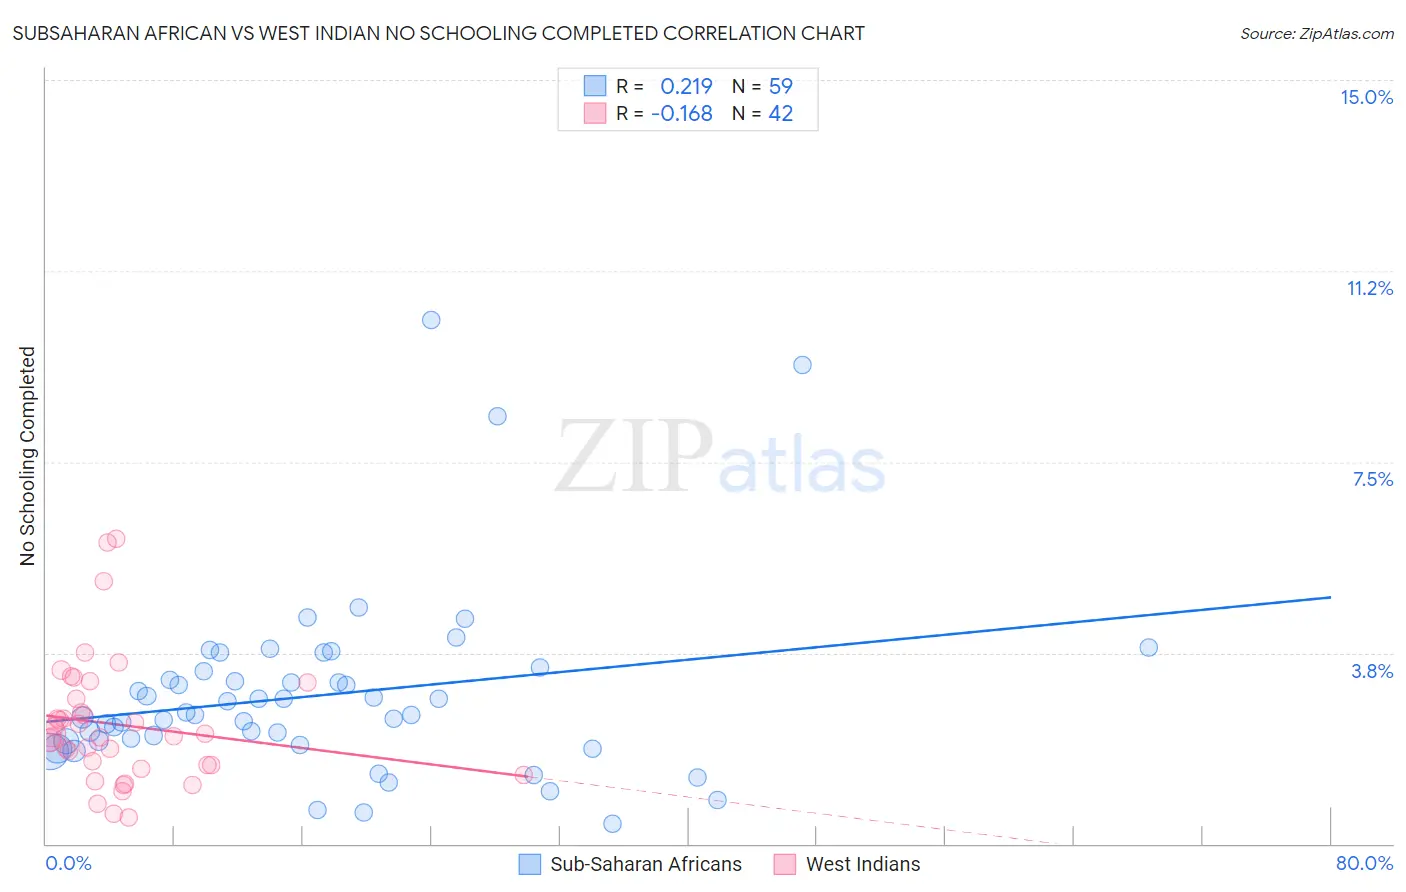
Subsaharan African vs West Indian No Schooling Completed Correlation Chart
The statistical analysis conducted on geographies consisting of 500,622,971 people shows a weak positive correlation between the proportion of Sub-Saharan Africans and percentage of population with no schooling in the United States with a correlation coefficient (R) of 0.219 and weighted average of 2.3%. Similarly, the statistical analysis conducted on geographies consisting of 253,089,115 people shows a poor negative correlation between the proportion of West Indians and percentage of population with no schooling in the United States with a correlation coefficient (R) of -0.168 and weighted average of 2.5%, a difference of 7.7%.
No Schooling Completed Correlation Summary
| Measurement | Subsaharan African | West Indian |
| Minimum | 0.39% | 0.51% |
| Maximum | 10.3% | 6.0% |
| Range | 9.9% | 5.5% |
| Mean | 2.9% | 2.3% |
| Median | 2.5% | 2.1% |
| Interquartile 25% (IQ1) | 2.0% | 1.6% |
| Interquartile 75% (IQ3) | 3.4% | 2.9% |
| Interquartile Range (IQR) | 1.4% | 1.3% |
| Standard Deviation (Sample) | 1.8% | 1.2% |
| Standard Deviation (Population) | 1.8% | 1.2% |
Similar Demographics by No Schooling Completed
Demographics Similar to Sub-Saharan Africans by No Schooling Completed
In terms of no schooling completed, the demographic groups most similar to Sub-Saharan Africans are Immigrants from Lebanon (2.3%, a difference of 0.15%), Immigrants from Sudan (2.3%, a difference of 0.17%), Immigrants from Costa Rica (2.3%, a difference of 0.26%), Tohono O'odham (2.3%, a difference of 0.44%), and Sudanese (2.3%, a difference of 0.44%).
| Demographics | Rating | Rank | No Schooling Completed |
| Immigrants | Zaire | 7.2 /100 | #215 | Tragic 2.3% |
| Tongans | 6.8 /100 | #216 | Tragic 2.3% |
| Immigrants | Syria | 6.6 /100 | #217 | Tragic 2.3% |
| Immigrants | Nepal | 6.4 /100 | #218 | Tragic 2.3% |
| Senegalese | 5.6 /100 | #219 | Tragic 2.3% |
| Immigrants | Costa Rica | 5.1 /100 | #220 | Tragic 2.3% |
| Immigrants | Sudan | 5.0 /100 | #221 | Tragic 2.3% |
| Sub-Saharan Africans | 4.7 /100 | #222 | Tragic 2.3% |
| Immigrants | Lebanon | 4.5 /100 | #223 | Tragic 2.3% |
| Tohono O'odham | 4.1 /100 | #224 | Tragic 2.3% |
| Sudanese | 4.1 /100 | #225 | Tragic 2.3% |
| Sierra Leoneans | 4.1 /100 | #226 | Tragic 2.3% |
| Immigrants | Uganda | 4.0 /100 | #227 | Tragic 2.3% |
| U.S. Virgin Islanders | 3.7 /100 | #228 | Tragic 2.3% |
| Immigrants | Pakistan | 3.6 /100 | #229 | Tragic 2.3% |
Demographics Similar to West Indians by No Schooling Completed
In terms of no schooling completed, the demographic groups most similar to West Indians are Fijian (2.5%, a difference of 0.080%), Indian (Asian) (2.5%, a difference of 0.18%), Yuman (2.5%, a difference of 0.25%), Immigrants from Liberia (2.5%, a difference of 0.31%), and Immigrants from Sierra Leone (2.5%, a difference of 0.48%).
| Demographics | Rating | Rank | No Schooling Completed |
| Assyrians/Chaldeans/Syriacs | 0.6 /100 | #258 | Tragic 2.5% |
| Immigrants | Jamaica | 0.6 /100 | #259 | Tragic 2.5% |
| Immigrants | Ethiopia | 0.6 /100 | #260 | Tragic 2.5% |
| Armenians | 0.5 /100 | #261 | Tragic 2.5% |
| Immigrants | Sierra Leone | 0.5 /100 | #262 | Tragic 2.5% |
| Immigrants | Liberia | 0.4 /100 | #263 | Tragic 2.5% |
| Indians (Asian) | 0.4 /100 | #264 | Tragic 2.5% |
| West Indians | 0.4 /100 | #265 | Tragic 2.5% |
| Fijians | 0.4 /100 | #266 | Tragic 2.5% |
| Yuman | 0.4 /100 | #267 | Tragic 2.5% |
| Taiwanese | 0.3 /100 | #268 | Tragic 2.5% |
| Immigrants | Nigeria | 0.2 /100 | #269 | Tragic 2.5% |
| Immigrants | Peru | 0.2 /100 | #270 | Tragic 2.5% |
| Cubans | 0.2 /100 | #271 | Tragic 2.5% |
| Immigrants | Bolivia | 0.2 /100 | #272 | Tragic 2.5% |