Subsaharan African vs Immigrants from Israel No Schooling Completed
COMPARE
Subsaharan African
Immigrants from Israel
No Schooling Completed
No Schooling Completed Comparison
Sub-Saharan Africans
Immigrants from Israel
2.3%
NO SCHOOLING COMPLETED
4.7/ 100
METRIC RATING
222nd/ 347
METRIC RANK
2.0%
NO SCHOOLING COMPLETED
85.4/ 100
METRIC RATING
138th/ 347
METRIC RANK
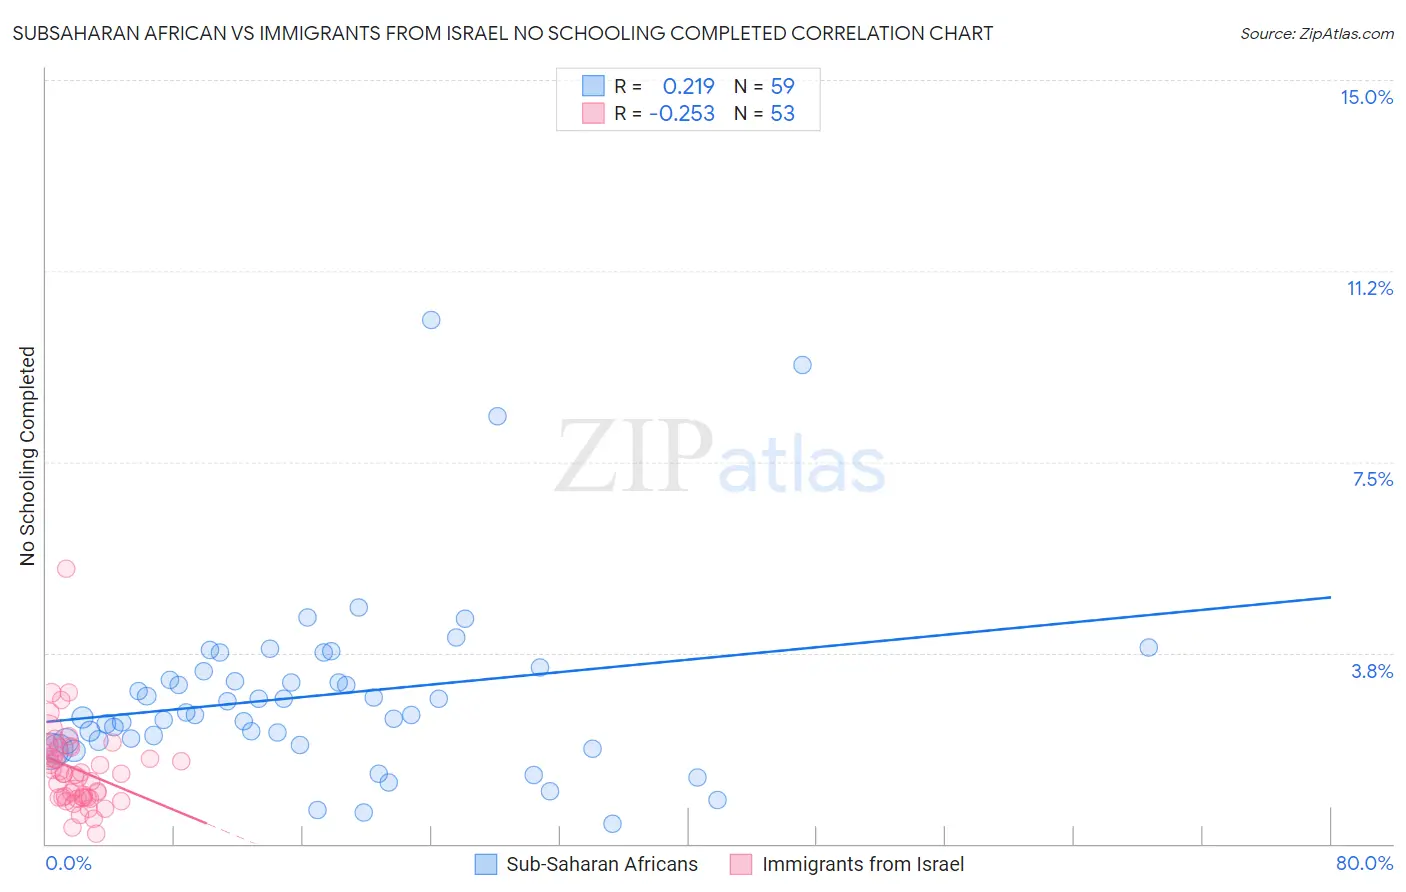
Subsaharan African vs Immigrants from Israel No Schooling Completed Correlation Chart
The statistical analysis conducted on geographies consisting of 500,622,971 people shows a weak positive correlation between the proportion of Sub-Saharan Africans and percentage of population with no schooling in the United States with a correlation coefficient (R) of 0.219 and weighted average of 2.3%. Similarly, the statistical analysis conducted on geographies consisting of 208,773,041 people shows a weak negative correlation between the proportion of Immigrants from Israel and percentage of population with no schooling in the United States with a correlation coefficient (R) of -0.253 and weighted average of 2.0%, a difference of 17.0%.
No Schooling Completed Correlation Summary
| Measurement | Subsaharan African | Immigrants from Israel |
| Minimum | 0.39% | 0.20% |
| Maximum | 10.3% | 5.4% |
| Range | 9.9% | 5.2% |
| Mean | 2.9% | 1.5% |
| Median | 2.5% | 1.4% |
| Interquartile 25% (IQ1) | 2.0% | 0.91% |
| Interquartile 75% (IQ3) | 3.4% | 1.8% |
| Interquartile Range (IQR) | 1.4% | 0.92% |
| Standard Deviation (Sample) | 1.8% | 0.84% |
| Standard Deviation (Population) | 1.8% | 0.83% |
Similar Demographics by No Schooling Completed
Demographics Similar to Sub-Saharan Africans by No Schooling Completed
In terms of no schooling completed, the demographic groups most similar to Sub-Saharan Africans are Immigrants from Lebanon (2.3%, a difference of 0.15%), Immigrants from Sudan (2.3%, a difference of 0.17%), Immigrants from Costa Rica (2.3%, a difference of 0.26%), Tohono O'odham (2.3%, a difference of 0.44%), and Sudanese (2.3%, a difference of 0.44%).
| Demographics | Rating | Rank | No Schooling Completed |
| Immigrants | Zaire | 7.2 /100 | #215 | Tragic 2.3% |
| Tongans | 6.8 /100 | #216 | Tragic 2.3% |
| Immigrants | Syria | 6.6 /100 | #217 | Tragic 2.3% |
| Immigrants | Nepal | 6.4 /100 | #218 | Tragic 2.3% |
| Senegalese | 5.6 /100 | #219 | Tragic 2.3% |
| Immigrants | Costa Rica | 5.1 /100 | #220 | Tragic 2.3% |
| Immigrants | Sudan | 5.0 /100 | #221 | Tragic 2.3% |
| Sub-Saharan Africans | 4.7 /100 | #222 | Tragic 2.3% |
| Immigrants | Lebanon | 4.5 /100 | #223 | Tragic 2.3% |
| Tohono O'odham | 4.1 /100 | #224 | Tragic 2.3% |
| Sudanese | 4.1 /100 | #225 | Tragic 2.3% |
| Sierra Leoneans | 4.1 /100 | #226 | Tragic 2.3% |
| Immigrants | Uganda | 4.0 /100 | #227 | Tragic 2.3% |
| U.S. Virgin Islanders | 3.7 /100 | #228 | Tragic 2.3% |
| Immigrants | Pakistan | 3.6 /100 | #229 | Tragic 2.3% |
Demographics Similar to Immigrants from Israel by No Schooling Completed
In terms of no schooling completed, the demographic groups most similar to Immigrants from Israel are Filipino (2.0%, a difference of 0.030%), Jordanian (2.0%, a difference of 0.25%), Marshallese (2.0%, a difference of 0.51%), Immigrants from Greece (2.0%, a difference of 0.52%), and Burmese (1.9%, a difference of 0.89%).
| Demographics | Rating | Rank | No Schooling Completed |
| Immigrants | Hungary | 91.6 /100 | #131 | Exceptional 1.9% |
| Colville | 90.4 /100 | #132 | Exceptional 1.9% |
| Immigrants | Turkey | 90.2 /100 | #133 | Exceptional 1.9% |
| Menominee | 89.6 /100 | #134 | Excellent 1.9% |
| Hmong | 88.5 /100 | #135 | Excellent 1.9% |
| Burmese | 88.2 /100 | #136 | Excellent 1.9% |
| Filipinos | 85.5 /100 | #137 | Excellent 2.0% |
| Immigrants | Israel | 85.4 /100 | #138 | Excellent 2.0% |
| Jordanians | 84.5 /100 | #139 | Excellent 2.0% |
| Marshallese | 83.5 /100 | #140 | Excellent 2.0% |
| Immigrants | Greece | 83.5 /100 | #141 | Excellent 2.0% |
| Venezuelans | 81.5 /100 | #142 | Excellent 2.0% |
| Immigrants | South Central Asia | 80.0 /100 | #143 | Good 2.0% |
| Alsatians | 79.1 /100 | #144 | Good 2.0% |
| Immigrants | Iran | 79.0 /100 | #145 | Good 2.0% |