Subsaharan African vs Immigrants from Latvia No Schooling Completed
COMPARE
Subsaharan African
Immigrants from Latvia
No Schooling Completed
No Schooling Completed Comparison
Sub-Saharan Africans
Immigrants from Latvia
2.3%
NO SCHOOLING COMPLETED
4.7/ 100
METRIC RATING
222nd/ 347
METRIC RANK
1.9%
NO SCHOOLING COMPLETED
96.7/ 100
METRIC RATING
110th/ 347
METRIC RANK
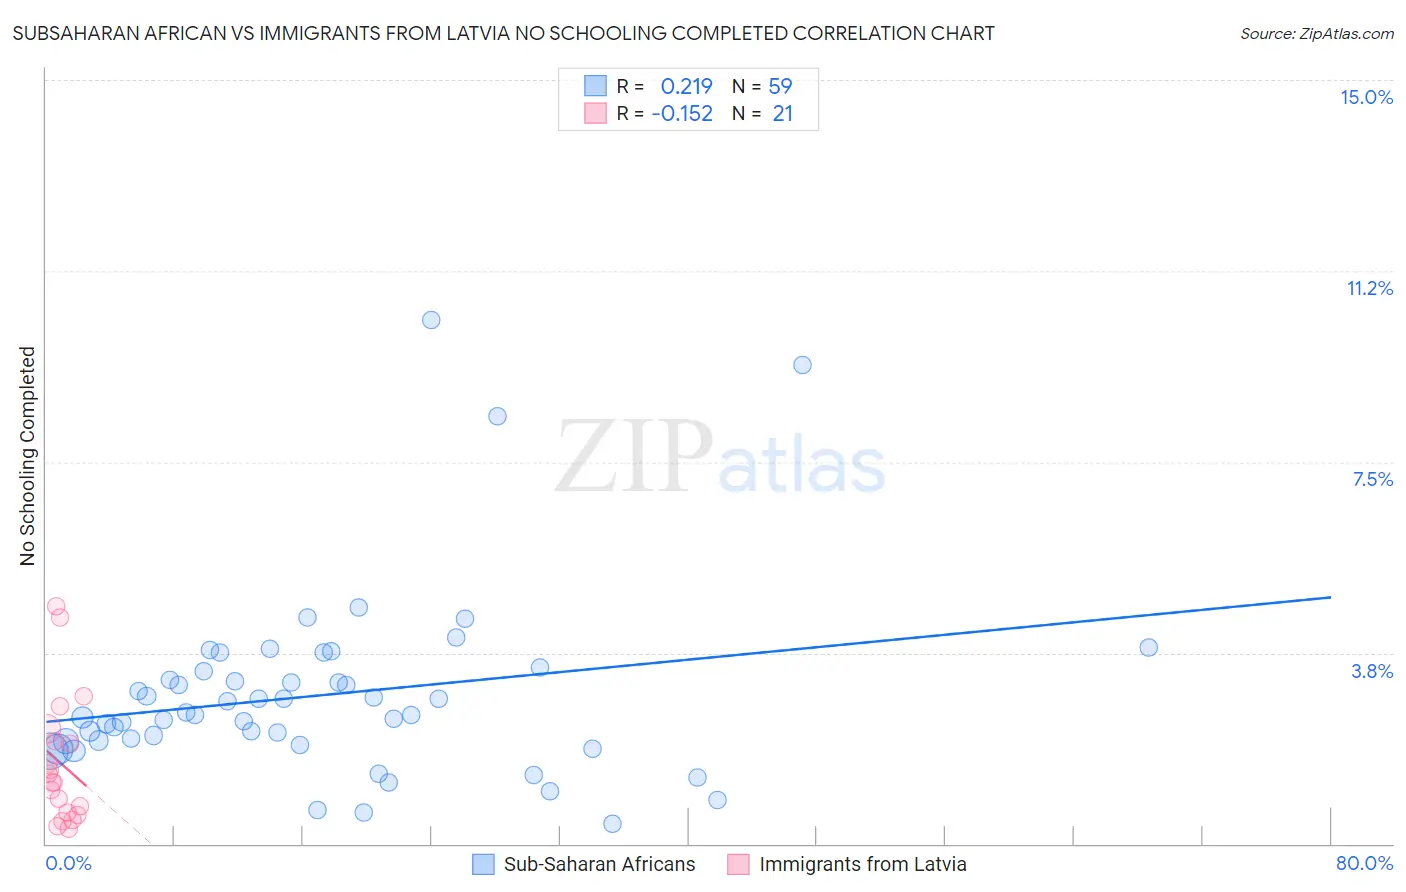
Subsaharan African vs Immigrants from Latvia No Schooling Completed Correlation Chart
The statistical analysis conducted on geographies consisting of 500,622,971 people shows a weak positive correlation between the proportion of Sub-Saharan Africans and percentage of population with no schooling in the United States with a correlation coefficient (R) of 0.219 and weighted average of 2.3%. Similarly, the statistical analysis conducted on geographies consisting of 113,303,053 people shows a poor negative correlation between the proportion of Immigrants from Latvia and percentage of population with no schooling in the United States with a correlation coefficient (R) of -0.152 and weighted average of 1.9%, a difference of 24.1%.
No Schooling Completed Correlation Summary
| Measurement | Subsaharan African | Immigrants from Latvia |
| Minimum | 0.39% | 0.30% |
| Maximum | 10.3% | 4.7% |
| Range | 9.9% | 4.4% |
| Mean | 2.9% | 1.6% |
| Median | 2.5% | 1.2% |
| Interquartile 25% (IQ1) | 2.0% | 0.59% |
| Interquartile 75% (IQ3) | 3.4% | 2.1% |
| Interquartile Range (IQR) | 1.4% | 1.5% |
| Standard Deviation (Sample) | 1.8% | 1.2% |
| Standard Deviation (Population) | 1.8% | 1.2% |
Similar Demographics by No Schooling Completed
Demographics Similar to Sub-Saharan Africans by No Schooling Completed
In terms of no schooling completed, the demographic groups most similar to Sub-Saharan Africans are Immigrants from Lebanon (2.3%, a difference of 0.15%), Immigrants from Sudan (2.3%, a difference of 0.17%), Immigrants from Costa Rica (2.3%, a difference of 0.26%), Tohono O'odham (2.3%, a difference of 0.44%), and Sudanese (2.3%, a difference of 0.44%).
| Demographics | Rating | Rank | No Schooling Completed |
| Immigrants | Zaire | 7.2 /100 | #215 | Tragic 2.3% |
| Tongans | 6.8 /100 | #216 | Tragic 2.3% |
| Immigrants | Syria | 6.6 /100 | #217 | Tragic 2.3% |
| Immigrants | Nepal | 6.4 /100 | #218 | Tragic 2.3% |
| Senegalese | 5.6 /100 | #219 | Tragic 2.3% |
| Immigrants | Costa Rica | 5.1 /100 | #220 | Tragic 2.3% |
| Immigrants | Sudan | 5.0 /100 | #221 | Tragic 2.3% |
| Sub-Saharan Africans | 4.7 /100 | #222 | Tragic 2.3% |
| Immigrants | Lebanon | 4.5 /100 | #223 | Tragic 2.3% |
| Tohono O'odham | 4.1 /100 | #224 | Tragic 2.3% |
| Sudanese | 4.1 /100 | #225 | Tragic 2.3% |
| Sierra Leoneans | 4.1 /100 | #226 | Tragic 2.3% |
| Immigrants | Uganda | 4.0 /100 | #227 | Tragic 2.3% |
| U.S. Virgin Islanders | 3.7 /100 | #228 | Tragic 2.3% |
| Immigrants | Pakistan | 3.6 /100 | #229 | Tragic 2.3% |
Demographics Similar to Immigrants from Latvia by No Schooling Completed
In terms of no schooling completed, the demographic groups most similar to Immigrants from Latvia are Immigrants from Saudi Arabia (1.9%, a difference of 0.13%), Immigrants from Japan (1.9%, a difference of 0.15%), Pueblo (1.9%, a difference of 0.33%), Okinawan (1.8%, a difference of 0.48%), and Immigrants from Zimbabwe (1.9%, a difference of 0.58%).
| Demographics | Rating | Rank | No Schooling Completed |
| Basques | 97.9 /100 | #103 | Exceptional 1.8% |
| Thais | 97.5 /100 | #104 | Exceptional 1.8% |
| German Russians | 97.5 /100 | #105 | Exceptional 1.8% |
| Immigrants | France | 97.3 /100 | #106 | Exceptional 1.8% |
| Yugoslavians | 97.2 /100 | #107 | Exceptional 1.8% |
| Okinawans | 97.1 /100 | #108 | Exceptional 1.8% |
| Immigrants | Saudi Arabia | 96.8 /100 | #109 | Exceptional 1.9% |
| Immigrants | Latvia | 96.7 /100 | #110 | Exceptional 1.9% |
| Immigrants | Japan | 96.6 /100 | #111 | Exceptional 1.9% |
| Pueblo | 96.4 /100 | #112 | Exceptional 1.9% |
| Immigrants | Zimbabwe | 96.2 /100 | #113 | Exceptional 1.9% |
| Immigrants | Norway | 96.1 /100 | #114 | Exceptional 1.9% |
| Syrians | 96.0 /100 | #115 | Exceptional 1.9% |
| Lebanese | 96.0 /100 | #116 | Exceptional 1.9% |
| Immigrants | Serbia | 95.8 /100 | #117 | Exceptional 1.9% |