Subsaharan African vs Immigrants from Kuwait No Schooling Completed
COMPARE
Subsaharan African
Immigrants from Kuwait
No Schooling Completed
No Schooling Completed Comparison
Sub-Saharan Africans
Immigrants from Kuwait
2.3%
NO SCHOOLING COMPLETED
4.7/ 100
METRIC RATING
222nd/ 347
METRIC RANK
1.9%
NO SCHOOLING COMPLETED
93.9/ 100
METRIC RATING
123rd/ 347
METRIC RANK
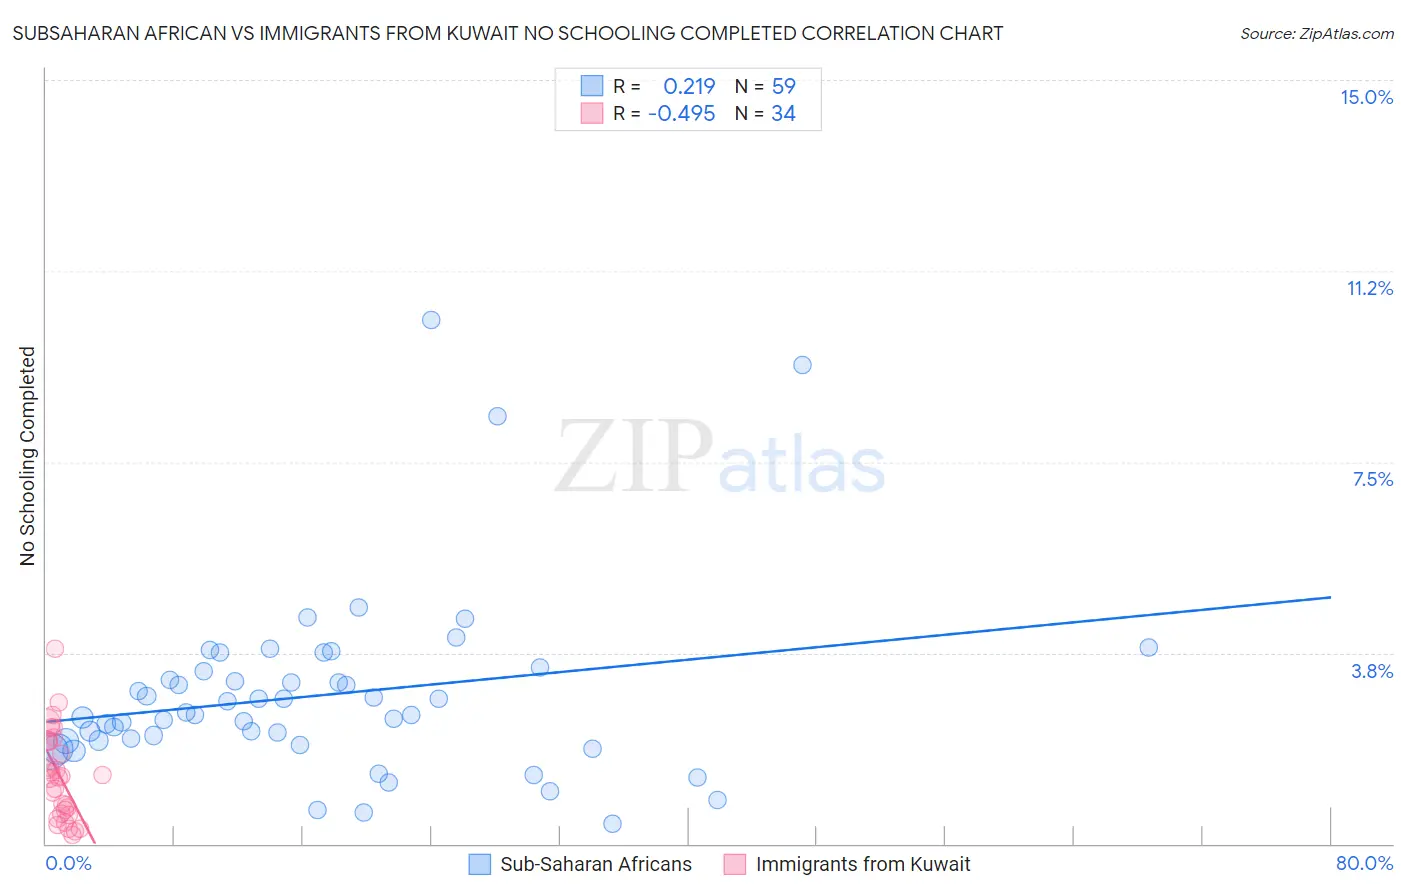
Subsaharan African vs Immigrants from Kuwait No Schooling Completed Correlation Chart
The statistical analysis conducted on geographies consisting of 500,622,971 people shows a weak positive correlation between the proportion of Sub-Saharan Africans and percentage of population with no schooling in the United States with a correlation coefficient (R) of 0.219 and weighted average of 2.3%. Similarly, the statistical analysis conducted on geographies consisting of 136,467,547 people shows a moderate negative correlation between the proportion of Immigrants from Kuwait and percentage of population with no schooling in the United States with a correlation coefficient (R) of -0.495 and weighted average of 1.9%, a difference of 21.2%.
No Schooling Completed Correlation Summary
| Measurement | Subsaharan African | Immigrants from Kuwait |
| Minimum | 0.39% | 0.18% |
| Maximum | 10.3% | 3.8% |
| Range | 9.9% | 3.7% |
| Mean | 2.9% | 1.3% |
| Median | 2.5% | 1.3% |
| Interquartile 25% (IQ1) | 2.0% | 0.59% |
| Interquartile 75% (IQ3) | 3.4% | 2.0% |
| Interquartile Range (IQR) | 1.4% | 1.4% |
| Standard Deviation (Sample) | 1.8% | 0.87% |
| Standard Deviation (Population) | 1.8% | 0.85% |
Similar Demographics by No Schooling Completed
Demographics Similar to Sub-Saharan Africans by No Schooling Completed
In terms of no schooling completed, the demographic groups most similar to Sub-Saharan Africans are Immigrants from Lebanon (2.3%, a difference of 0.15%), Immigrants from Sudan (2.3%, a difference of 0.17%), Immigrants from Costa Rica (2.3%, a difference of 0.26%), Tohono O'odham (2.3%, a difference of 0.44%), and Sudanese (2.3%, a difference of 0.44%).
| Demographics | Rating | Rank | No Schooling Completed |
| Immigrants | Zaire | 7.2 /100 | #215 | Tragic 2.3% |
| Tongans | 6.8 /100 | #216 | Tragic 2.3% |
| Immigrants | Syria | 6.6 /100 | #217 | Tragic 2.3% |
| Immigrants | Nepal | 6.4 /100 | #218 | Tragic 2.3% |
| Senegalese | 5.6 /100 | #219 | Tragic 2.3% |
| Immigrants | Costa Rica | 5.1 /100 | #220 | Tragic 2.3% |
| Immigrants | Sudan | 5.0 /100 | #221 | Tragic 2.3% |
| Sub-Saharan Africans | 4.7 /100 | #222 | Tragic 2.3% |
| Immigrants | Lebanon | 4.5 /100 | #223 | Tragic 2.3% |
| Tohono O'odham | 4.1 /100 | #224 | Tragic 2.3% |
| Sudanese | 4.1 /100 | #225 | Tragic 2.3% |
| Sierra Leoneans | 4.1 /100 | #226 | Tragic 2.3% |
| Immigrants | Uganda | 4.0 /100 | #227 | Tragic 2.3% |
| U.S. Virgin Islanders | 3.7 /100 | #228 | Tragic 2.3% |
| Immigrants | Pakistan | 3.6 /100 | #229 | Tragic 2.3% |
Demographics Similar to Immigrants from Kuwait by No Schooling Completed
In terms of no schooling completed, the demographic groups most similar to Immigrants from Kuwait are Cambodian (1.9%, a difference of 0.080%), Immigrants from Europe (1.9%, a difference of 0.17%), Cree (1.9%, a difference of 0.36%), Immigrants from Croatia (1.9%, a difference of 0.39%), and Immigrants from Bulgaria (1.9%, a difference of 0.46%).
| Demographics | Rating | Rank | No Schooling Completed |
| Lebanese | 96.0 /100 | #116 | Exceptional 1.9% |
| Immigrants | Serbia | 95.8 /100 | #117 | Exceptional 1.9% |
| Spanish | 95.5 /100 | #118 | Exceptional 1.9% |
| Iroquois | 95.1 /100 | #119 | Exceptional 1.9% |
| Immigrants | Bulgaria | 94.6 /100 | #120 | Exceptional 1.9% |
| Immigrants | Croatia | 94.5 /100 | #121 | Exceptional 1.9% |
| Cree | 94.5 /100 | #122 | Exceptional 1.9% |
| Immigrants | Kuwait | 93.9 /100 | #123 | Exceptional 1.9% |
| Cambodians | 93.8 /100 | #124 | Exceptional 1.9% |
| Immigrants | Europe | 93.7 /100 | #125 | Exceptional 1.9% |
| Immigrants | Romania | 92.6 /100 | #126 | Exceptional 1.9% |
| Israelis | 92.4 /100 | #127 | Exceptional 1.9% |
| Spaniards | 92.3 /100 | #128 | Exceptional 1.9% |
| Seminole | 92.0 /100 | #129 | Exceptional 1.9% |
| Palestinians | 91.8 /100 | #130 | Exceptional 1.9% |