Ecuadorian vs Aleut No Schooling Completed
COMPARE
Ecuadorian
Aleut
No Schooling Completed
No Schooling Completed Comparison
Ecuadorians
Aleuts
3.0%
NO SCHOOLING COMPLETED
0.0/ 100
METRIC RATING
305th/ 347
METRIC RANK
1.6%
NO SCHOOLING COMPLETED
99.9/ 100
METRIC RATING
36th/ 347
METRIC RANK
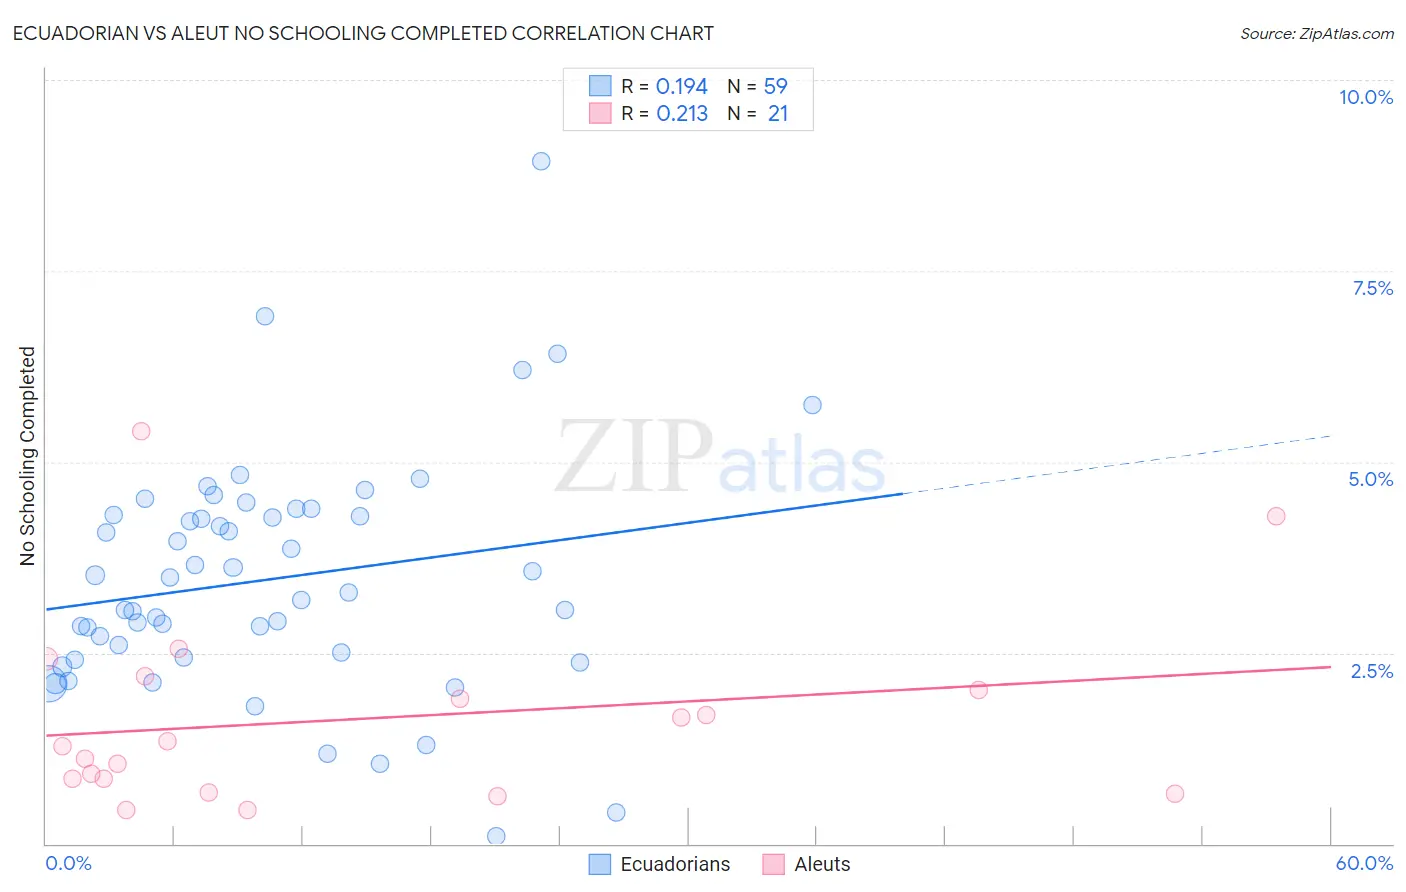
Ecuadorian vs Aleut No Schooling Completed Correlation Chart
The statistical analysis conducted on geographies consisting of 315,790,309 people shows a poor positive correlation between the proportion of Ecuadorians and percentage of population with no schooling in the United States with a correlation coefficient (R) of 0.194 and weighted average of 3.0%. Similarly, the statistical analysis conducted on geographies consisting of 61,492,558 people shows a weak positive correlation between the proportion of Aleuts and percentage of population with no schooling in the United States with a correlation coefficient (R) of 0.213 and weighted average of 1.6%, a difference of 87.9%.
No Schooling Completed Correlation Summary
| Measurement | Ecuadorian | Aleut |
| Minimum | 0.10% | 0.44% |
| Maximum | 8.9% | 5.4% |
| Range | 8.8% | 5.0% |
| Mean | 3.5% | 1.6% |
| Median | 3.3% | 1.3% |
| Interquartile 25% (IQ1) | 2.4% | 0.76% |
| Interquartile 75% (IQ3) | 4.3% | 2.1% |
| Interquartile Range (IQR) | 1.9% | 1.3% |
| Standard Deviation (Sample) | 1.5% | 1.3% |
| Standard Deviation (Population) | 1.5% | 1.2% |
Similar Demographics by No Schooling Completed
Demographics Similar to Ecuadorians by No Schooling Completed
In terms of no schooling completed, the demographic groups most similar to Ecuadorians are Nicaraguan (2.9%, a difference of 0.47%), Somali (2.9%, a difference of 0.66%), Immigrants from Caribbean (2.9%, a difference of 1.7%), Belizean (3.0%, a difference of 1.7%), and Immigrants from Haiti (3.0%, a difference of 1.7%).
| Demographics | Rating | Rank | No Schooling Completed |
| Immigrants | Dominica | 0.0 /100 | #298 | Tragic 2.8% |
| Central American Indians | 0.0 /100 | #299 | Tragic 2.8% |
| Haitians | 0.0 /100 | #300 | Tragic 2.9% |
| Immigrants | South Eastern Asia | 0.0 /100 | #301 | Tragic 2.9% |
| Immigrants | Caribbean | 0.0 /100 | #302 | Tragic 2.9% |
| Somalis | 0.0 /100 | #303 | Tragic 2.9% |
| Nicaraguans | 0.0 /100 | #304 | Tragic 2.9% |
| Ecuadorians | 0.0 /100 | #305 | Tragic 3.0% |
| Belizeans | 0.0 /100 | #306 | Tragic 3.0% |
| Immigrants | Haiti | 0.0 /100 | #307 | Tragic 3.0% |
| Immigrants | Somalia | 0.0 /100 | #308 | Tragic 3.0% |
| Hispanics or Latinos | 0.0 /100 | #309 | Tragic 3.0% |
| Guyanese | 0.0 /100 | #310 | Tragic 3.0% |
| Immigrants | Azores | 0.0 /100 | #311 | Tragic 3.0% |
| Sri Lankans | 0.0 /100 | #312 | Tragic 3.0% |
Demographics Similar to Aleuts by No Schooling Completed
In terms of no schooling completed, the demographic groups most similar to Aleuts are Belgian (1.6%, a difference of 0.27%), Northern European (1.6%, a difference of 0.40%), Native Hawaiian (1.6%, a difference of 0.67%), Eastern European (1.6%, a difference of 1.0%), and Luxembourger (1.6%, a difference of 1.0%).
| Demographics | Rating | Rank | No Schooling Completed |
| Lumbee | 100.0 /100 | #29 | Exceptional 1.5% |
| British | 100.0 /100 | #30 | Exceptional 1.5% |
| Inupiat | 100.0 /100 | #31 | Exceptional 1.5% |
| Swiss | 100.0 /100 | #32 | Exceptional 1.5% |
| Italians | 100.0 /100 | #33 | Exceptional 1.5% |
| Latvians | 100.0 /100 | #34 | Exceptional 1.5% |
| Eastern Europeans | 100.0 /100 | #35 | Exceptional 1.6% |
| Aleuts | 99.9 /100 | #36 | Exceptional 1.6% |
| Belgians | 99.9 /100 | #37 | Exceptional 1.6% |
| Northern Europeans | 99.9 /100 | #38 | Exceptional 1.6% |
| Native Hawaiians | 99.9 /100 | #39 | Exceptional 1.6% |
| Luxembourgers | 99.9 /100 | #40 | Exceptional 1.6% |
| Hungarians | 99.9 /100 | #41 | Exceptional 1.6% |
| Bulgarians | 99.9 /100 | #42 | Exceptional 1.6% |
| Australians | 99.9 /100 | #43 | Exceptional 1.6% |