Cheyenne vs Aleut No Schooling Completed
COMPARE
Cheyenne
Aleut
No Schooling Completed
No Schooling Completed Comparison
Cheyenne
Aleuts
2.1%
NO SCHOOLING COMPLETED
58.6/ 100
METRIC RATING
168th/ 347
METRIC RANK
1.6%
NO SCHOOLING COMPLETED
99.9/ 100
METRIC RATING
36th/ 347
METRIC RANK
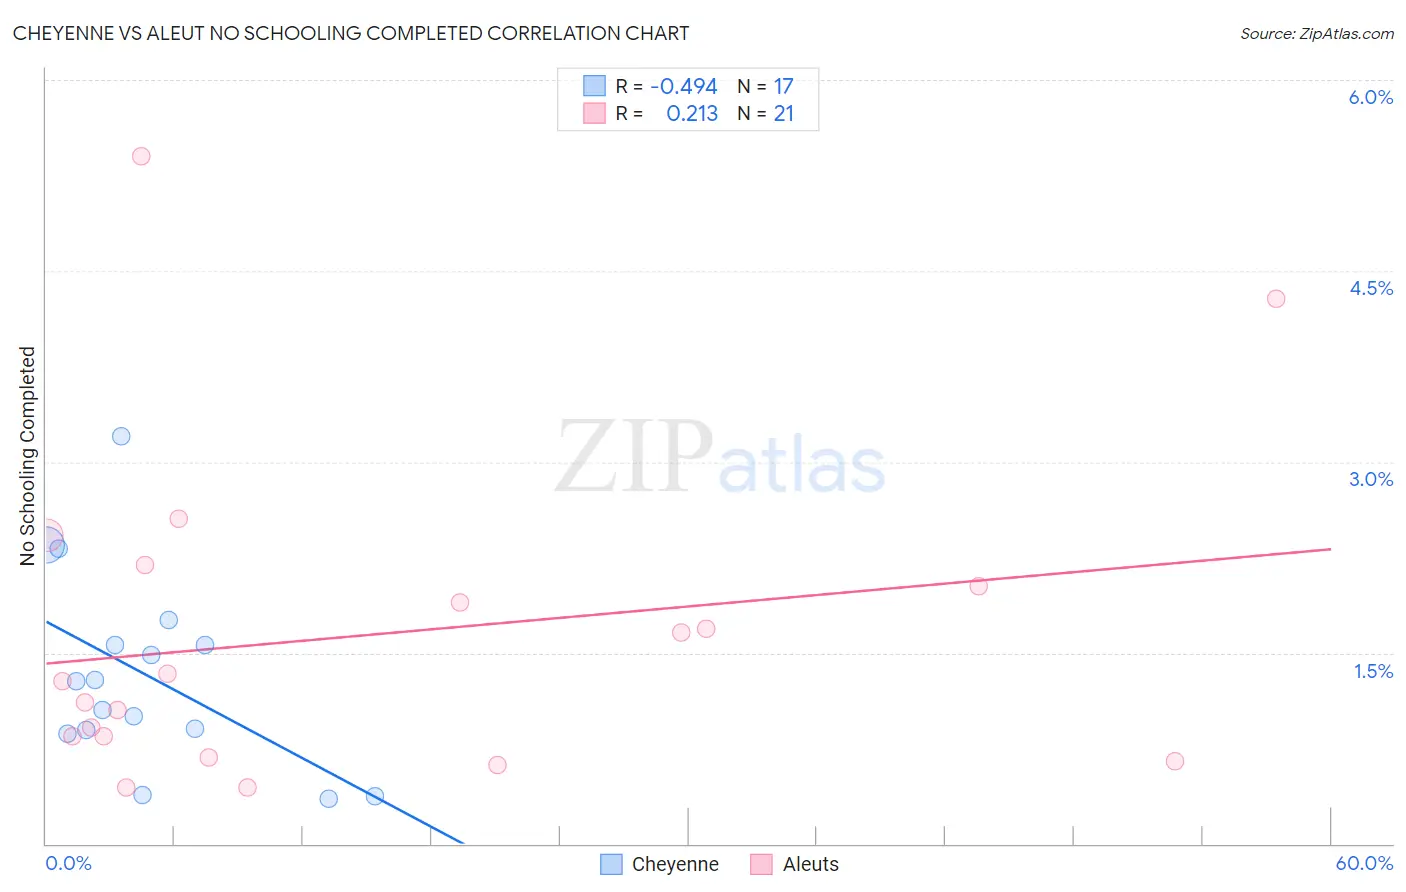
Cheyenne vs Aleut No Schooling Completed Correlation Chart
The statistical analysis conducted on geographies consisting of 80,362,041 people shows a moderate negative correlation between the proportion of Cheyenne and percentage of population with no schooling in the United States with a correlation coefficient (R) of -0.494 and weighted average of 2.1%. Similarly, the statistical analysis conducted on geographies consisting of 61,492,558 people shows a weak positive correlation between the proportion of Aleuts and percentage of population with no schooling in the United States with a correlation coefficient (R) of 0.213 and weighted average of 1.6%, a difference of 31.5%.
No Schooling Completed Correlation Summary
| Measurement | Cheyenne | Aleut |
| Minimum | 0.36% | 0.44% |
| Maximum | 3.2% | 5.4% |
| Range | 2.8% | 5.0% |
| Mean | 1.3% | 1.6% |
| Median | 1.3% | 1.3% |
| Interquartile 25% (IQ1) | 0.88% | 0.76% |
| Interquartile 75% (IQ3) | 1.7% | 2.1% |
| Interquartile Range (IQR) | 0.78% | 1.3% |
| Standard Deviation (Sample) | 0.76% | 1.3% |
| Standard Deviation (Population) | 0.74% | 1.2% |
Similar Demographics by No Schooling Completed
Demographics Similar to Cheyenne by No Schooling Completed
In terms of no schooling completed, the demographic groups most similar to Cheyenne are Egyptian (2.1%, a difference of 0.080%), Dutch West Indian (2.1%, a difference of 0.18%), Brazilian (2.1%, a difference of 0.23%), Apache (2.1%, a difference of 0.27%), and Comanche (2.1%, a difference of 0.29%).
| Demographics | Rating | Rank | No Schooling Completed |
| Ugandans | 64.6 /100 | #161 | Good 2.0% |
| Immigrants | Brazil | 63.8 /100 | #162 | Good 2.1% |
| Albanians | 62.2 /100 | #163 | Good 2.1% |
| Comanche | 60.7 /100 | #164 | Good 2.1% |
| Brazilians | 60.2 /100 | #165 | Good 2.1% |
| Dutch West Indians | 59.9 /100 | #166 | Average 2.1% |
| Egyptians | 59.2 /100 | #167 | Average 2.1% |
| Cheyenne | 58.6 /100 | #168 | Average 2.1% |
| Apache | 56.7 /100 | #169 | Average 2.1% |
| Argentineans | 56.0 /100 | #170 | Average 2.1% |
| Immigrants | Poland | 55.2 /100 | #171 | Average 2.1% |
| Immigrants | Argentina | 52.7 /100 | #172 | Average 2.1% |
| Immigrants | Belarus | 51.8 /100 | #173 | Average 2.1% |
| Immigrants | Micronesia | 50.0 /100 | #174 | Average 2.1% |
| Arabs | 46.4 /100 | #175 | Average 2.1% |
Demographics Similar to Aleuts by No Schooling Completed
In terms of no schooling completed, the demographic groups most similar to Aleuts are Belgian (1.6%, a difference of 0.27%), Northern European (1.6%, a difference of 0.40%), Native Hawaiian (1.6%, a difference of 0.67%), Eastern European (1.6%, a difference of 1.0%), and Luxembourger (1.6%, a difference of 1.0%).
| Demographics | Rating | Rank | No Schooling Completed |
| Lumbee | 100.0 /100 | #29 | Exceptional 1.5% |
| British | 100.0 /100 | #30 | Exceptional 1.5% |
| Inupiat | 100.0 /100 | #31 | Exceptional 1.5% |
| Swiss | 100.0 /100 | #32 | Exceptional 1.5% |
| Italians | 100.0 /100 | #33 | Exceptional 1.5% |
| Latvians | 100.0 /100 | #34 | Exceptional 1.5% |
| Eastern Europeans | 100.0 /100 | #35 | Exceptional 1.6% |
| Aleuts | 99.9 /100 | #36 | Exceptional 1.6% |
| Belgians | 99.9 /100 | #37 | Exceptional 1.6% |
| Northern Europeans | 99.9 /100 | #38 | Exceptional 1.6% |
| Native Hawaiians | 99.9 /100 | #39 | Exceptional 1.6% |
| Luxembourgers | 99.9 /100 | #40 | Exceptional 1.6% |
| Hungarians | 99.9 /100 | #41 | Exceptional 1.6% |
| Bulgarians | 99.9 /100 | #42 | Exceptional 1.6% |
| Australians | 99.9 /100 | #43 | Exceptional 1.6% |