Immigrants from Trinidad and Tobago vs Aleut No Schooling Completed
COMPARE
Immigrants from Trinidad and Tobago
Aleut
No Schooling Completed
No Schooling Completed Comparison
Immigrants from Trinidad and Tobago
Aleuts
2.6%
NO SCHOOLING COMPLETED
0.0/ 100
METRIC RATING
283rd/ 347
METRIC RANK
1.6%
NO SCHOOLING COMPLETED
99.9/ 100
METRIC RATING
36th/ 347
METRIC RANK
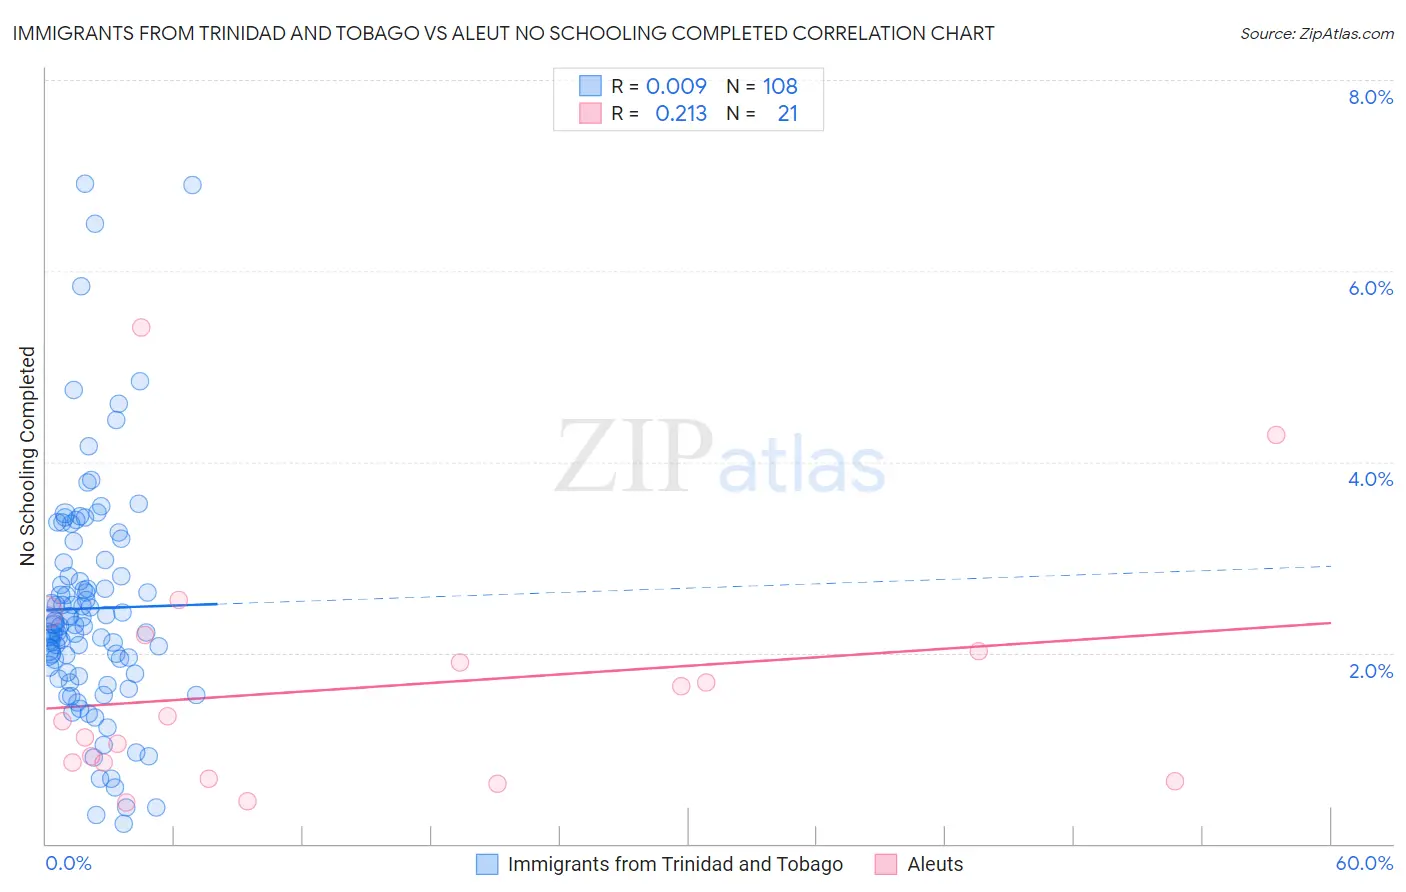
Immigrants from Trinidad and Tobago vs Aleut No Schooling Completed Correlation Chart
The statistical analysis conducted on geographies consisting of 222,835,417 people shows no correlation between the proportion of Immigrants from Trinidad and Tobago and percentage of population with no schooling in the United States with a correlation coefficient (R) of 0.009 and weighted average of 2.6%. Similarly, the statistical analysis conducted on geographies consisting of 61,492,558 people shows a weak positive correlation between the proportion of Aleuts and percentage of population with no schooling in the United States with a correlation coefficient (R) of 0.213 and weighted average of 1.6%, a difference of 67.7%.
No Schooling Completed Correlation Summary
| Measurement | Immigrants from Trinidad and Tobago | Aleut |
| Minimum | 0.21% | 0.44% |
| Maximum | 6.9% | 5.4% |
| Range | 6.7% | 5.0% |
| Mean | 2.5% | 1.6% |
| Median | 2.3% | 1.3% |
| Interquartile 25% (IQ1) | 1.8% | 0.76% |
| Interquartile 75% (IQ3) | 2.9% | 2.1% |
| Interquartile Range (IQR) | 1.1% | 1.3% |
| Standard Deviation (Sample) | 1.2% | 1.3% |
| Standard Deviation (Population) | 1.2% | 1.2% |
Similar Demographics by No Schooling Completed
Demographics Similar to Immigrants from Trinidad and Tobago by No Schooling Completed
In terms of no schooling completed, the demographic groups most similar to Immigrants from Trinidad and Tobago are Immigrants from West Indies (2.7%, a difference of 0.72%), Immigrants from Barbados (2.7%, a difference of 0.80%), Immigrants from Ghana (2.6%, a difference of 1.2%), Immigrants from Portugal (2.7%, a difference of 1.2%), and Afghan (2.6%, a difference of 1.4%).
| Demographics | Rating | Rank | No Schooling Completed |
| Immigrants | Western Africa | 0.1 /100 | #276 | Tragic 2.6% |
| Immigrants | Philippines | 0.1 /100 | #277 | Tragic 2.6% |
| Immigrants | Uzbekistan | 0.1 /100 | #278 | Tragic 2.6% |
| Barbadians | 0.1 /100 | #279 | Tragic 2.6% |
| Trinidadians and Tobagonians | 0.1 /100 | #280 | Tragic 2.6% |
| Afghans | 0.1 /100 | #281 | Tragic 2.6% |
| Immigrants | Ghana | 0.1 /100 | #282 | Tragic 2.6% |
| Immigrants | Trinidad and Tobago | 0.0 /100 | #283 | Tragic 2.6% |
| Immigrants | West Indies | 0.0 /100 | #284 | Tragic 2.7% |
| Immigrants | Barbados | 0.0 /100 | #285 | Tragic 2.7% |
| Immigrants | Portugal | 0.0 /100 | #286 | Tragic 2.7% |
| Immigrants | Afghanistan | 0.0 /100 | #287 | Tragic 2.7% |
| Immigrants | St. Vincent and the Grenadines | 0.0 /100 | #288 | Tragic 2.7% |
| Immigrants | Thailand | 0.0 /100 | #289 | Tragic 2.7% |
| Immigrants | Hong Kong | 0.0 /100 | #290 | Tragic 2.7% |
Demographics Similar to Aleuts by No Schooling Completed
In terms of no schooling completed, the demographic groups most similar to Aleuts are Belgian (1.6%, a difference of 0.27%), Northern European (1.6%, a difference of 0.40%), Native Hawaiian (1.6%, a difference of 0.67%), Eastern European (1.6%, a difference of 1.0%), and Luxembourger (1.6%, a difference of 1.0%).
| Demographics | Rating | Rank | No Schooling Completed |
| Lumbee | 100.0 /100 | #29 | Exceptional 1.5% |
| British | 100.0 /100 | #30 | Exceptional 1.5% |
| Inupiat | 100.0 /100 | #31 | Exceptional 1.5% |
| Swiss | 100.0 /100 | #32 | Exceptional 1.5% |
| Italians | 100.0 /100 | #33 | Exceptional 1.5% |
| Latvians | 100.0 /100 | #34 | Exceptional 1.5% |
| Eastern Europeans | 100.0 /100 | #35 | Exceptional 1.6% |
| Aleuts | 99.9 /100 | #36 | Exceptional 1.6% |
| Belgians | 99.9 /100 | #37 | Exceptional 1.6% |
| Northern Europeans | 99.9 /100 | #38 | Exceptional 1.6% |
| Native Hawaiians | 99.9 /100 | #39 | Exceptional 1.6% |
| Luxembourgers | 99.9 /100 | #40 | Exceptional 1.6% |
| Hungarians | 99.9 /100 | #41 | Exceptional 1.6% |
| Bulgarians | 99.9 /100 | #42 | Exceptional 1.6% |
| Australians | 99.9 /100 | #43 | Exceptional 1.6% |