Spanish vs Jamaican Associate's Degree
COMPARE
Spanish
Jamaican
Associate's Degree
Associate's Degree Comparison
Spanish
Jamaicans
44.4%
ASSOCIATE'S DEGREE
9.4/ 100
METRIC RATING
218th/ 347
METRIC RANK
42.1%
ASSOCIATE'S DEGREE
0.7/ 100
METRIC RATING
249th/ 347
METRIC RANK
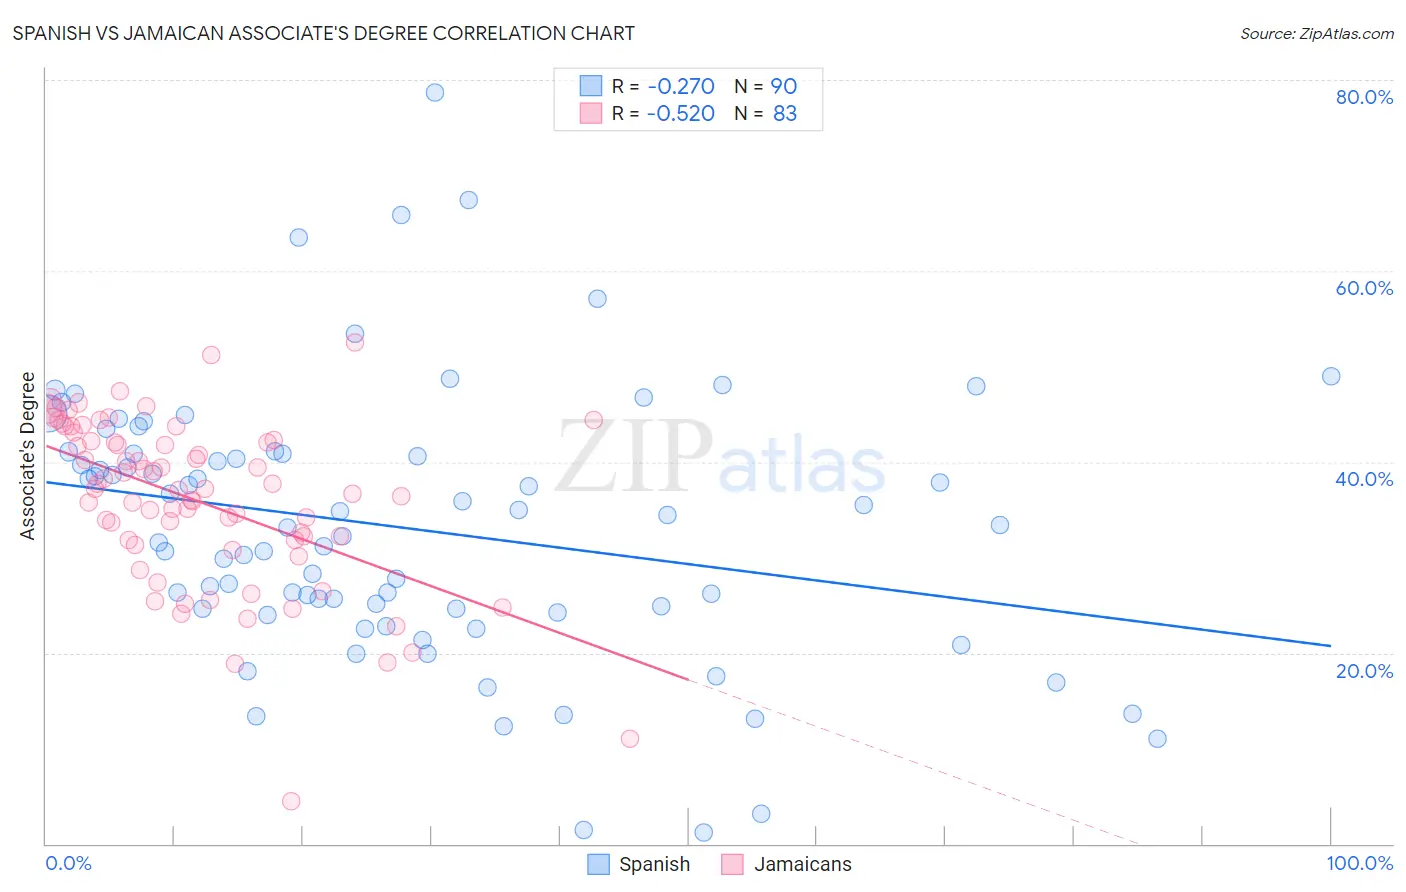
Spanish vs Jamaican Associate's Degree Correlation Chart
The statistical analysis conducted on geographies consisting of 422,178,546 people shows a weak negative correlation between the proportion of Spanish and percentage of population with at least associate's degree education in the United States with a correlation coefficient (R) of -0.270 and weighted average of 44.4%. Similarly, the statistical analysis conducted on geographies consisting of 368,030,405 people shows a substantial negative correlation between the proportion of Jamaicans and percentage of population with at least associate's degree education in the United States with a correlation coefficient (R) of -0.520 and weighted average of 42.1%, a difference of 5.4%.
Associate's Degree Correlation Summary
| Measurement | Spanish | Jamaican |
| Minimum | 1.2% | 4.5% |
| Maximum | 78.7% | 52.5% |
| Range | 77.5% | 48.0% |
| Mean | 33.1% | 36.0% |
| Median | 33.2% | 37.1% |
| Interquartile 25% (IQ1) | 24.7% | 31.8% |
| Interquartile 75% (IQ3) | 40.9% | 42.2% |
| Interquartile Range (IQR) | 16.2% | 10.4% |
| Standard Deviation (Sample) | 14.1% | 8.8% |
| Standard Deviation (Population) | 14.1% | 8.8% |
Similar Demographics by Associate's Degree
Demographics Similar to Spanish by Associate's Degree
In terms of associate's degree, the demographic groups most similar to Spanish are Immigrants (44.5%, a difference of 0.25%), Immigrants from Nigeria (44.6%, a difference of 0.43%), White/Caucasian (44.2%, a difference of 0.48%), Portuguese (44.1%, a difference of 0.55%), and Immigrants from Panama (44.7%, a difference of 0.61%).
| Demographics | Rating | Rank | Associate's Degree |
| Immigrants | Zaire | 16.6 /100 | #211 | Poor 45.0% |
| French Canadians | 15.0 /100 | #212 | Poor 44.9% |
| Immigrants | Ghana | 14.2 /100 | #213 | Poor 44.8% |
| Immigrants | Middle Africa | 12.7 /100 | #214 | Poor 44.7% |
| Immigrants | Panama | 12.4 /100 | #215 | Poor 44.7% |
| Immigrants | Nigeria | 11.4 /100 | #216 | Poor 44.6% |
| Immigrants | Immigrants | 10.5 /100 | #217 | Poor 44.5% |
| Spanish | 9.4 /100 | #218 | Tragic 44.4% |
| Whites/Caucasians | 7.5 /100 | #219 | Tragic 44.2% |
| Portuguese | 7.2 /100 | #220 | Tragic 44.1% |
| Immigrants | Western Africa | 6.6 /100 | #221 | Tragic 44.1% |
| Barbadians | 5.8 /100 | #222 | Tragic 43.9% |
| Sub-Saharan Africans | 5.5 /100 | #223 | Tragic 43.9% |
| West Indians | 5.2 /100 | #224 | Tragic 43.8% |
| Guamanians/Chamorros | 4.8 /100 | #225 | Tragic 43.8% |
Demographics Similar to Jamaicans by Associate's Degree
In terms of associate's degree, the demographic groups most similar to Jamaicans are U.S. Virgin Islander (42.1%, a difference of 0.010%), Immigrants from Bahamas (42.1%, a difference of 0.030%), Immigrants from Ecuador (42.2%, a difference of 0.14%), Immigrants from Fiji (42.2%, a difference of 0.23%), and Delaware (42.3%, a difference of 0.32%).
| Demographics | Rating | Rank | Associate's Degree |
| Immigrants | West Indies | 1.0 /100 | #242 | Tragic 42.4% |
| Guyanese | 1.0 /100 | #243 | Tragic 42.3% |
| Immigrants | Liberia | 0.9 /100 | #244 | Tragic 42.3% |
| Immigrants | Cambodia | 0.9 /100 | #245 | Tragic 42.3% |
| Delaware | 0.9 /100 | #246 | Tragic 42.3% |
| Immigrants | Fiji | 0.8 /100 | #247 | Tragic 42.2% |
| Immigrants | Ecuador | 0.8 /100 | #248 | Tragic 42.2% |
| Jamaicans | 0.7 /100 | #249 | Tragic 42.1% |
| U.S. Virgin Islanders | 0.7 /100 | #250 | Tragic 42.1% |
| Immigrants | Bahamas | 0.7 /100 | #251 | Tragic 42.1% |
| French American Indians | 0.6 /100 | #252 | Tragic 42.0% |
| Indonesians | 0.6 /100 | #253 | Tragic 41.9% |
| Cubans | 0.6 /100 | #254 | Tragic 41.9% |
| Immigrants | Guyana | 0.5 /100 | #255 | Tragic 41.8% |
| Immigrants | Congo | 0.5 /100 | #256 | Tragic 41.8% |