Immigrants from Cabo Verde vs Israeli College, Under 1 year
COMPARE
Immigrants from Cabo Verde
Israeli
College, Under 1 year
College, Under 1 year Comparison
Immigrants from Cabo Verde
Israelis
53.7%
COLLEGE, UNDER 1 YEAR
0.0/ 100
METRIC RATING
341st/ 347
METRIC RANK
70.2%
COLLEGE, UNDER 1 YEAR
99.9/ 100
METRIC RATING
43rd/ 347
METRIC RANK
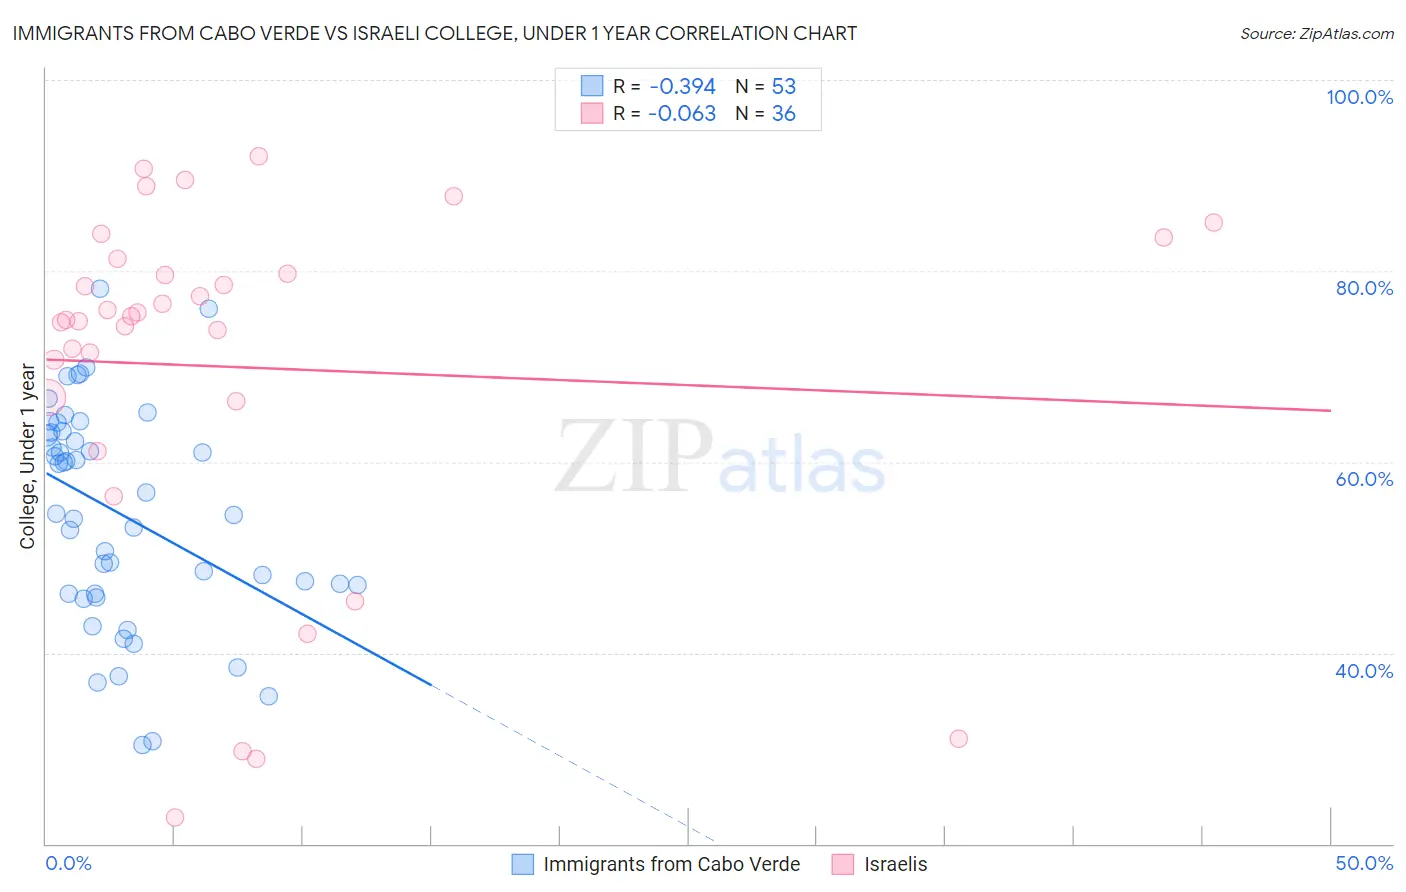
Immigrants from Cabo Verde vs Israeli College, Under 1 year Correlation Chart
The statistical analysis conducted on geographies consisting of 38,158,666 people shows a mild negative correlation between the proportion of Immigrants from Cabo Verde and percentage of population with at least college, under 1 year education in the United States with a correlation coefficient (R) of -0.394 and weighted average of 53.7%. Similarly, the statistical analysis conducted on geographies consisting of 211,218,479 people shows a slight negative correlation between the proportion of Israelis and percentage of population with at least college, under 1 year education in the United States with a correlation coefficient (R) of -0.063 and weighted average of 70.2%, a difference of 30.8%.
College, Under 1 year Correlation Summary
| Measurement | Immigrants from Cabo Verde | Israeli |
| Minimum | 30.4% | 22.7% |
| Maximum | 78.2% | 92.0% |
| Range | 47.8% | 69.3% |
| Mean | 54.6% | 69.9% |
| Median | 54.6% | 75.0% |
| Interquartile 25% (IQ1) | 46.2% | 66.5% |
| Interquartile 75% (IQ3) | 63.1% | 80.5% |
| Interquartile Range (IQR) | 16.9% | 14.0% |
| Standard Deviation (Sample) | 11.4% | 18.6% |
| Standard Deviation (Population) | 11.3% | 18.3% |
Similar Demographics by College, Under 1 year
Demographics Similar to Immigrants from Cabo Verde by College, Under 1 year
In terms of college, under 1 year, the demographic groups most similar to Immigrants from Cabo Verde are Immigrants from Mexico (53.7%, a difference of 0.060%), Spanish American Indian (54.0%, a difference of 0.51%), Immigrants from Dominican Republic (54.0%, a difference of 0.59%), Lumbee (54.2%, a difference of 1.0%), and Immigrants from Central America (54.4%, a difference of 1.4%).
| Demographics | Rating | Rank | College, Under 1 year |
| Yuman | 0.0 /100 | #333 | Tragic 55.1% |
| Immigrants | Azores | 0.0 /100 | #334 | Tragic 54.7% |
| Inupiat | 0.0 /100 | #335 | Tragic 54.6% |
| Pennsylvania Germans | 0.0 /100 | #336 | Tragic 54.5% |
| Immigrants | Central America | 0.0 /100 | #337 | Tragic 54.4% |
| Lumbee | 0.0 /100 | #338 | Tragic 54.2% |
| Immigrants | Dominican Republic | 0.0 /100 | #339 | Tragic 54.0% |
| Spanish American Indians | 0.0 /100 | #340 | Tragic 54.0% |
| Immigrants | Cabo Verde | 0.0 /100 | #341 | Tragic 53.7% |
| Immigrants | Mexico | 0.0 /100 | #342 | Tragic 53.7% |
| Tohono O'odham | 0.0 /100 | #343 | Tragic 52.8% |
| Yakama | 0.0 /100 | #344 | Tragic 52.6% |
| Pima | 0.0 /100 | #345 | Tragic 51.4% |
| Houma | 0.0 /100 | #346 | Tragic 47.6% |
| Yup'ik | 0.0 /100 | #347 | Tragic 45.8% |
Demographics Similar to Israelis by College, Under 1 year
In terms of college, under 1 year, the demographic groups most similar to Israelis are New Zealander (70.2%, a difference of 0.0%), Immigrants from Norway (70.2%, a difference of 0.020%), Immigrants from Lithuania (70.3%, a difference of 0.070%), Immigrants from Kuwait (70.3%, a difference of 0.11%), and Immigrants from Latvia (70.1%, a difference of 0.14%).
| Demographics | Rating | Rank | College, Under 1 year |
| Immigrants | Sri Lanka | 99.9 /100 | #36 | Exceptional 70.5% |
| Immigrants | Saudi Arabia | 99.9 /100 | #37 | Exceptional 70.4% |
| Australians | 99.9 /100 | #38 | Exceptional 70.4% |
| Bhutanese | 99.9 /100 | #39 | Exceptional 70.3% |
| Immigrants | Turkey | 99.9 /100 | #40 | Exceptional 70.3% |
| Immigrants | Kuwait | 99.9 /100 | #41 | Exceptional 70.3% |
| Immigrants | Lithuania | 99.9 /100 | #42 | Exceptional 70.3% |
| Israelis | 99.9 /100 | #43 | Exceptional 70.2% |
| New Zealanders | 99.9 /100 | #44 | Exceptional 70.2% |
| Immigrants | Norway | 99.9 /100 | #45 | Exceptional 70.2% |
| Immigrants | Latvia | 99.9 /100 | #46 | Exceptional 70.1% |
| Immigrants | Bulgaria | 99.8 /100 | #47 | Exceptional 70.0% |
| Immigrants | Netherlands | 99.8 /100 | #48 | Exceptional 70.0% |
| Immigrants | Austria | 99.8 /100 | #49 | Exceptional 70.0% |
| Zimbabweans | 99.8 /100 | #50 | Exceptional 69.9% |