Vietnamese vs Immigrants from Romania 8th Grade
COMPARE
Vietnamese
Immigrants from Romania
8th Grade
8th Grade Comparison
Vietnamese
Immigrants from Romania
93.5%
8TH GRADE
0.0/ 100
METRIC RATING
315th/ 347
METRIC RANK
96.2%
8TH GRADE
94.1/ 100
METRIC RATING
125th/ 347
METRIC RANK
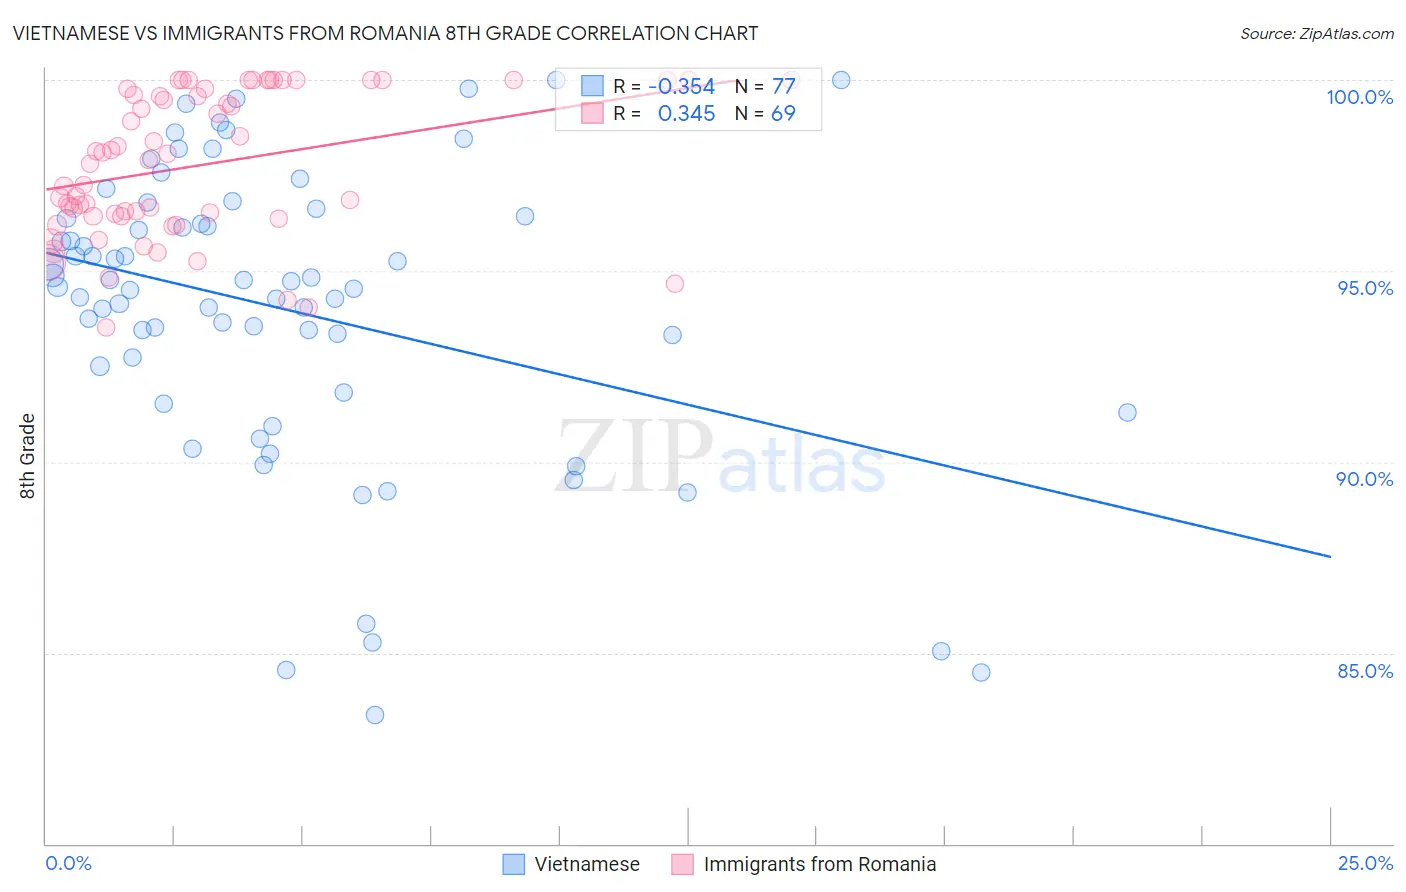
Vietnamese vs Immigrants from Romania 8th Grade Correlation Chart
The statistical analysis conducted on geographies consisting of 170,728,240 people shows a mild negative correlation between the proportion of Vietnamese and percentage of population with at least 8th grade education in the United States with a correlation coefficient (R) of -0.354 and weighted average of 93.5%. Similarly, the statistical analysis conducted on geographies consisting of 257,008,799 people shows a mild positive correlation between the proportion of Immigrants from Romania and percentage of population with at least 8th grade education in the United States with a correlation coefficient (R) of 0.345 and weighted average of 96.2%, a difference of 2.9%.
8th Grade Correlation Summary
| Measurement | Vietnamese | Immigrants from Romania |
| Minimum | 83.4% | 93.5% |
| Maximum | 100.0% | 100.0% |
| Range | 16.6% | 6.5% |
| Mean | 94.0% | 97.8% |
| Median | 94.6% | 97.9% |
| Interquartile 25% (IQ1) | 92.2% | 96.4% |
| Interquartile 75% (IQ3) | 96.4% | 99.8% |
| Interquartile Range (IQR) | 4.3% | 3.4% |
| Standard Deviation (Sample) | 3.8% | 1.9% |
| Standard Deviation (Population) | 3.8% | 1.9% |
Similar Demographics by 8th Grade
Demographics Similar to Vietnamese by 8th Grade
In terms of 8th grade, the demographic groups most similar to Vietnamese are Immigrants from Vietnam (93.5%, a difference of 0.010%), Immigrants from Caribbean (93.5%, a difference of 0.020%), Cape Verdean (93.5%, a difference of 0.050%), Japanese (93.6%, a difference of 0.090%), and Immigrants from Bangladesh (93.6%, a difference of 0.090%).
| Demographics | Rating | Rank | 8th Grade |
| Ecuadorians | 0.0 /100 | #308 | Tragic 93.6% |
| Immigrants | Immigrants | 0.0 /100 | #309 | Tragic 93.6% |
| Japanese | 0.0 /100 | #310 | Tragic 93.6% |
| Immigrants | Bangladesh | 0.0 /100 | #311 | Tragic 93.6% |
| Cape Verdeans | 0.0 /100 | #312 | Tragic 93.5% |
| Immigrants | Caribbean | 0.0 /100 | #313 | Tragic 93.5% |
| Immigrants | Vietnam | 0.0 /100 | #314 | Tragic 93.5% |
| Vietnamese | 0.0 /100 | #315 | Tragic 93.5% |
| Immigrants | Cambodia | 0.0 /100 | #316 | Tragic 93.3% |
| Immigrants | Ecuador | 0.0 /100 | #317 | Tragic 93.3% |
| Puerto Ricans | 0.0 /100 | #318 | Tragic 93.2% |
| Immigrants | Cuba | 0.0 /100 | #319 | Tragic 93.2% |
| Immigrants | Fiji | 0.0 /100 | #320 | Tragic 93.2% |
| Belizeans | 0.0 /100 | #321 | Tragic 93.1% |
| Nicaraguans | 0.0 /100 | #322 | Tragic 93.0% |
Demographics Similar to Immigrants from Romania by 8th Grade
In terms of 8th grade, the demographic groups most similar to Immigrants from Romania are Choctaw (96.2%, a difference of 0.0%), Immigrants from Serbia (96.2%, a difference of 0.0%), Palestinian (96.2%, a difference of 0.010%), Immigrants from Bosnia and Herzegovina (96.2%, a difference of 0.010%), and Filipino (96.2%, a difference of 0.020%).
| Demographics | Rating | Rank | 8th Grade |
| Immigrants | Norway | 95.7 /100 | #118 | Exceptional 96.2% |
| Immigrants | Switzerland | 95.3 /100 | #119 | Exceptional 96.2% |
| Immigrants | France | 95.3 /100 | #120 | Exceptional 96.2% |
| Immigrants | Bulgaria | 95.3 /100 | #121 | Exceptional 96.2% |
| Immigrants | Europe | 95.3 /100 | #122 | Exceptional 96.2% |
| Filipinos | 94.6 /100 | #123 | Exceptional 96.2% |
| Palestinians | 94.6 /100 | #124 | Exceptional 96.2% |
| Immigrants | Romania | 94.1 /100 | #125 | Exceptional 96.2% |
| Choctaw | 94.0 /100 | #126 | Exceptional 96.2% |
| Immigrants | Serbia | 94.0 /100 | #127 | Exceptional 96.2% |
| Immigrants | Bosnia and Herzegovina | 93.9 /100 | #128 | Exceptional 96.2% |
| Cheyenne | 93.3 /100 | #129 | Exceptional 96.1% |
| Soviet Union | 92.6 /100 | #130 | Exceptional 96.1% |
| Pueblo | 92.3 /100 | #131 | Exceptional 96.1% |
| Immigrants | Kuwait | 92.2 /100 | #132 | Exceptional 96.1% |