Irish vs Immigrants from Romania 8th Grade
COMPARE
Irish
Immigrants from Romania
8th Grade
8th Grade Comparison
Irish
Immigrants from Romania
97.3%
8TH GRADE
100.0/ 100
METRIC RATING
17th/ 347
METRIC RANK
96.2%
8TH GRADE
94.1/ 100
METRIC RATING
125th/ 347
METRIC RANK
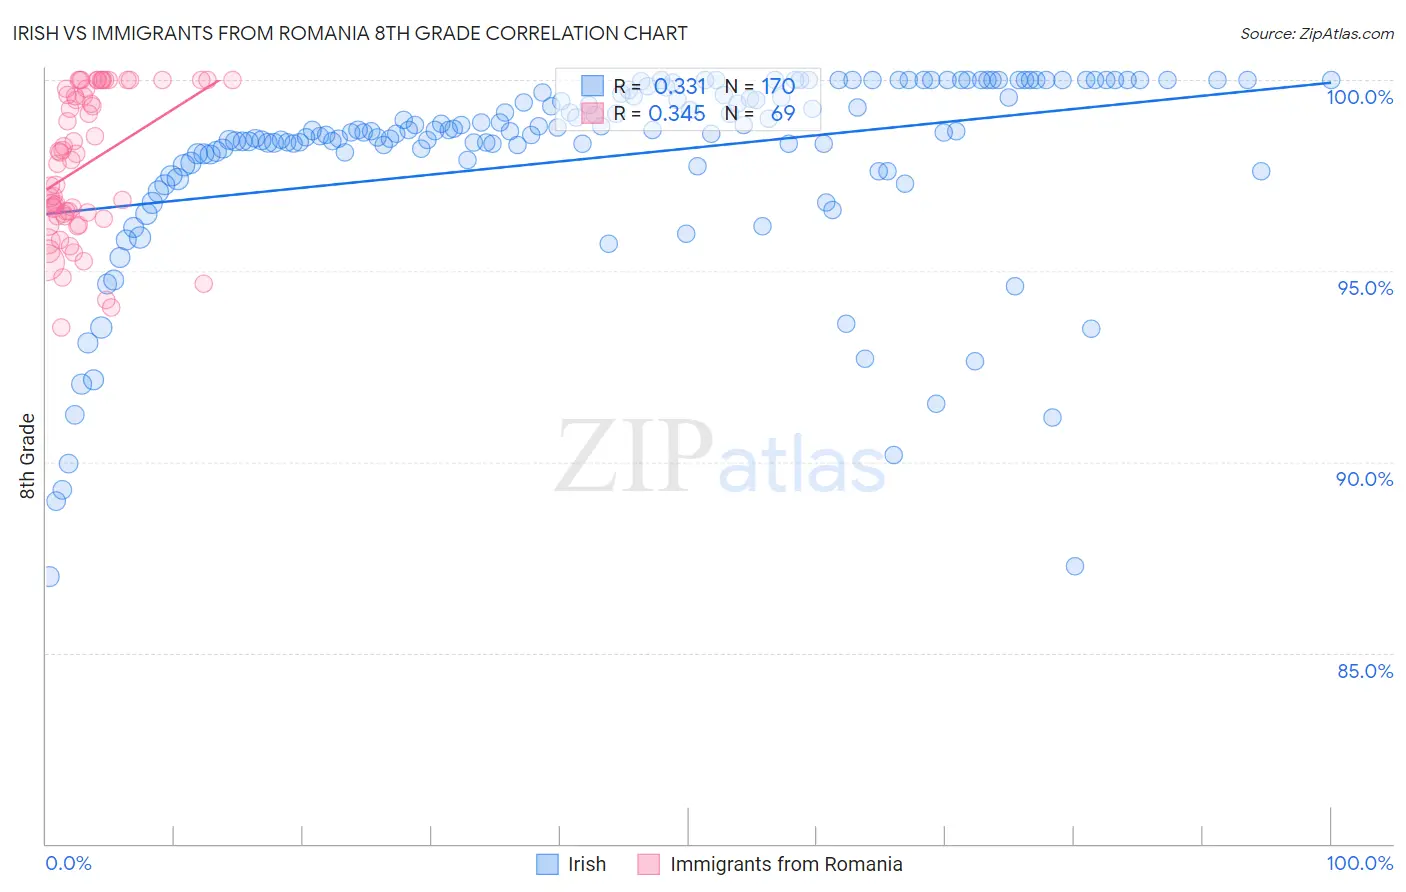
Irish vs Immigrants from Romania 8th Grade Correlation Chart
The statistical analysis conducted on geographies consisting of 580,710,287 people shows a mild positive correlation between the proportion of Irish and percentage of population with at least 8th grade education in the United States with a correlation coefficient (R) of 0.331 and weighted average of 97.3%. Similarly, the statistical analysis conducted on geographies consisting of 257,008,799 people shows a mild positive correlation between the proportion of Immigrants from Romania and percentage of population with at least 8th grade education in the United States with a correlation coefficient (R) of 0.345 and weighted average of 96.2%, a difference of 1.2%.
8th Grade Correlation Summary
| Measurement | Irish | Immigrants from Romania |
| Minimum | 87.0% | 93.5% |
| Maximum | 100.0% | 100.0% |
| Range | 13.0% | 6.5% |
| Mean | 98.0% | 97.8% |
| Median | 98.7% | 97.9% |
| Interquartile 25% (IQ1) | 97.9% | 96.4% |
| Interquartile 75% (IQ3) | 99.7% | 99.8% |
| Interquartile Range (IQR) | 1.8% | 3.4% |
| Standard Deviation (Sample) | 2.6% | 1.9% |
| Standard Deviation (Population) | 2.6% | 1.9% |
Similar Demographics by 8th Grade
Demographics Similar to Irish by 8th Grade
In terms of 8th grade, the demographic groups most similar to Irish are Tlingit-Haida (97.3%, a difference of 0.010%), Lithuanian (97.3%, a difference of 0.010%), Scottish (97.3%, a difference of 0.020%), Pennsylvania German (97.3%, a difference of 0.040%), and Alaskan Athabascan (97.3%, a difference of 0.050%).
| Demographics | Rating | Rank | 8th Grade |
| Slovenes | 100.0 /100 | #10 | Exceptional 97.5% |
| Poles | 100.0 /100 | #11 | Exceptional 97.4% |
| Swedes | 100.0 /100 | #12 | Exceptional 97.4% |
| Alaskan Athabascans | 100.0 /100 | #13 | Exceptional 97.3% |
| English | 100.0 /100 | #14 | Exceptional 97.3% |
| Pennsylvania Germans | 100.0 /100 | #15 | Exceptional 97.3% |
| Tlingit-Haida | 100.0 /100 | #16 | Exceptional 97.3% |
| Irish | 100.0 /100 | #17 | Exceptional 97.3% |
| Lithuanians | 100.0 /100 | #18 | Exceptional 97.3% |
| Scottish | 100.0 /100 | #19 | Exceptional 97.3% |
| Croatians | 100.0 /100 | #20 | Exceptional 97.2% |
| Danes | 100.0 /100 | #21 | Exceptional 97.2% |
| Welsh | 100.0 /100 | #22 | Exceptional 97.2% |
| French Canadians | 100.0 /100 | #23 | Exceptional 97.2% |
| Scandinavians | 100.0 /100 | #24 | Exceptional 97.2% |
Demographics Similar to Immigrants from Romania by 8th Grade
In terms of 8th grade, the demographic groups most similar to Immigrants from Romania are Choctaw (96.2%, a difference of 0.0%), Immigrants from Serbia (96.2%, a difference of 0.0%), Palestinian (96.2%, a difference of 0.010%), Immigrants from Bosnia and Herzegovina (96.2%, a difference of 0.010%), and Filipino (96.2%, a difference of 0.020%).
| Demographics | Rating | Rank | 8th Grade |
| Immigrants | Norway | 95.7 /100 | #118 | Exceptional 96.2% |
| Immigrants | Switzerland | 95.3 /100 | #119 | Exceptional 96.2% |
| Immigrants | France | 95.3 /100 | #120 | Exceptional 96.2% |
| Immigrants | Bulgaria | 95.3 /100 | #121 | Exceptional 96.2% |
| Immigrants | Europe | 95.3 /100 | #122 | Exceptional 96.2% |
| Filipinos | 94.6 /100 | #123 | Exceptional 96.2% |
| Palestinians | 94.6 /100 | #124 | Exceptional 96.2% |
| Immigrants | Romania | 94.1 /100 | #125 | Exceptional 96.2% |
| Choctaw | 94.0 /100 | #126 | Exceptional 96.2% |
| Immigrants | Serbia | 94.0 /100 | #127 | Exceptional 96.2% |
| Immigrants | Bosnia and Herzegovina | 93.9 /100 | #128 | Exceptional 96.2% |
| Cheyenne | 93.3 /100 | #129 | Exceptional 96.1% |
| Soviet Union | 92.6 /100 | #130 | Exceptional 96.1% |
| Pueblo | 92.3 /100 | #131 | Exceptional 96.1% |
| Immigrants | Kuwait | 92.2 /100 | #132 | Exceptional 96.1% |