Cypriot vs Immigrants from El Salvador 12th Grade, No Diploma
COMPARE
Cypriot
Immigrants from El Salvador
12th Grade, No Diploma
12th Grade, No Diploma Comparison
Cypriots
Immigrants from El Salvador
93.1%
12TH GRADE, NO DIPLOMA
99.9/ 100
METRIC RATING
27th/ 347
METRIC RANK
83.6%
12TH GRADE, NO DIPLOMA
0.0/ 100
METRIC RATING
343rd/ 347
METRIC RANK
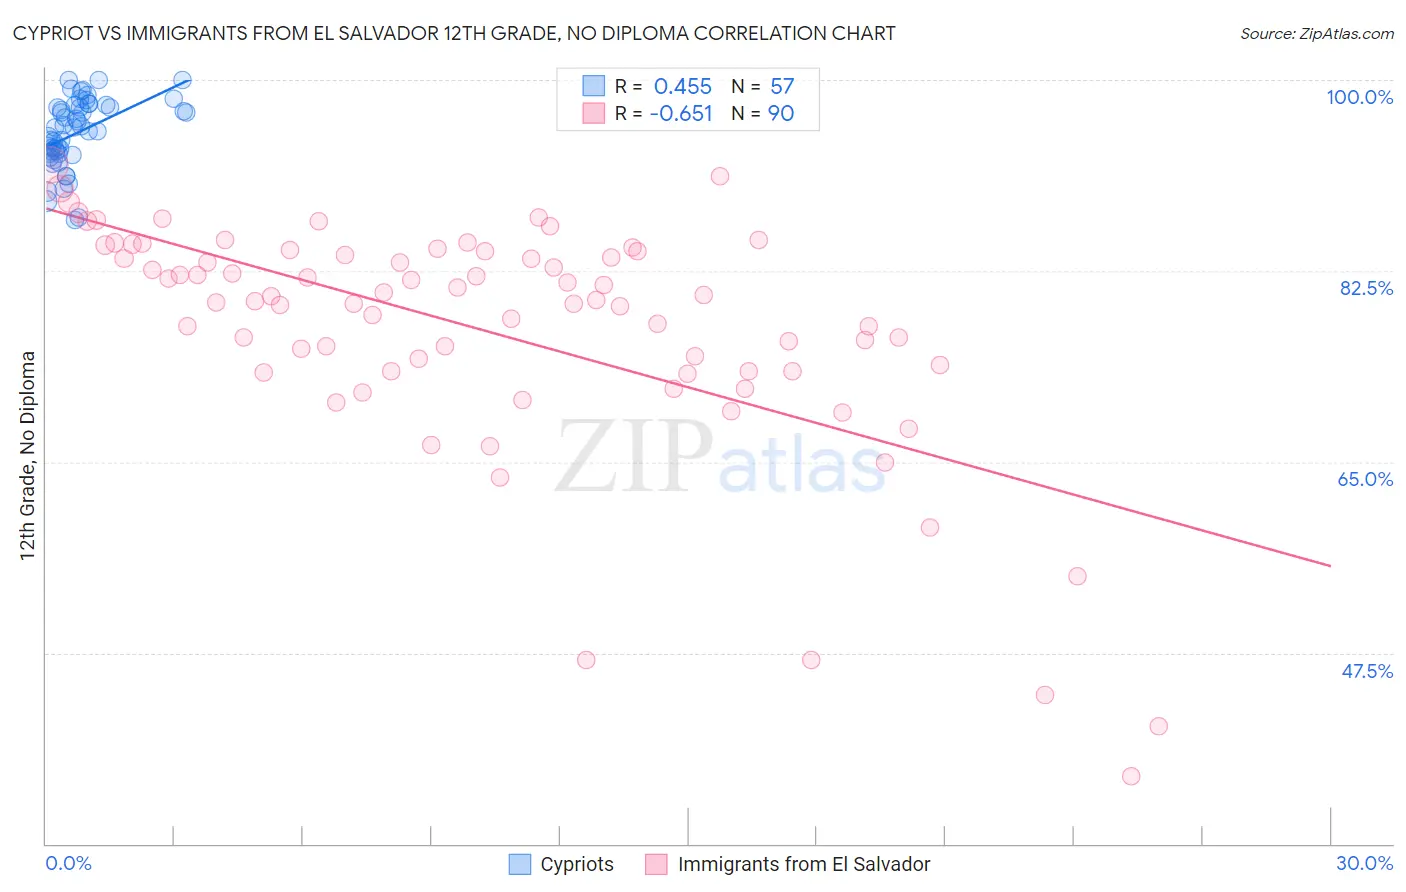
Cypriot vs Immigrants from El Salvador 12th Grade, No Diploma Correlation Chart
The statistical analysis conducted on geographies consisting of 61,870,289 people shows a moderate positive correlation between the proportion of Cypriots and percentage of population with at least 12th grade (no diploma) education in the United States with a correlation coefficient (R) of 0.455 and weighted average of 93.1%. Similarly, the statistical analysis conducted on geographies consisting of 357,852,938 people shows a significant negative correlation between the proportion of Immigrants from El Salvador and percentage of population with at least 12th grade (no diploma) education in the United States with a correlation coefficient (R) of -0.651 and weighted average of 83.6%, a difference of 11.4%.
12th Grade, No Diploma Correlation Summary
| Measurement | Cypriot | Immigrants from El Salvador |
| Minimum | 87.2% | 36.2% |
| Maximum | 100.0% | 92.2% |
| Range | 12.8% | 56.0% |
| Mean | 95.1% | 77.1% |
| Median | 95.6% | 79.8% |
| Interquartile 25% (IQ1) | 93.3% | 73.3% |
| Interquartile 75% (IQ3) | 97.6% | 84.3% |
| Interquartile Range (IQR) | 4.3% | 11.0% |
| Standard Deviation (Sample) | 3.1% | 10.9% |
| Standard Deviation (Population) | 3.1% | 10.9% |
Similar Demographics by 12th Grade, No Diploma
Demographics Similar to Cypriots by 12th Grade, No Diploma
In terms of 12th grade, no diploma, the demographic groups most similar to Cypriots are Russian (93.2%, a difference of 0.020%), Czech (93.2%, a difference of 0.030%), Immigrants from Northern Europe (93.1%, a difference of 0.040%), Thai (93.2%, a difference of 0.050%), and Iranian (93.1%, a difference of 0.050%).
| Demographics | Rating | Rank | 12th Grade, No Diploma |
| Filipinos | 99.9 /100 | #20 | Exceptional 93.2% |
| Italians | 99.9 /100 | #21 | Exceptional 93.2% |
| Estonians | 99.9 /100 | #22 | Exceptional 93.2% |
| Scandinavians | 99.9 /100 | #23 | Exceptional 93.2% |
| Thais | 99.9 /100 | #24 | Exceptional 93.2% |
| Czechs | 99.9 /100 | #25 | Exceptional 93.2% |
| Russians | 99.9 /100 | #26 | Exceptional 93.2% |
| Cypriots | 99.9 /100 | #27 | Exceptional 93.1% |
| Immigrants | Northern Europe | 99.9 /100 | #28 | Exceptional 93.1% |
| Iranians | 99.9 /100 | #29 | Exceptional 93.1% |
| Immigrants | Lithuania | 99.9 /100 | #30 | Exceptional 93.1% |
| Immigrants | Ireland | 99.9 /100 | #31 | Exceptional 93.1% |
| Europeans | 99.9 /100 | #32 | Exceptional 93.1% |
| Immigrants | Scotland | 99.9 /100 | #33 | Exceptional 93.0% |
| Okinawans | 99.9 /100 | #34 | Exceptional 93.0% |
Demographics Similar to Immigrants from El Salvador by 12th Grade, No Diploma
In terms of 12th grade, no diploma, the demographic groups most similar to Immigrants from El Salvador are Houma (83.7%, a difference of 0.16%), Immigrants from Guatemala (84.0%, a difference of 0.51%), Mexican (84.1%, a difference of 0.65%), Immigrants from Central America (83.0%, a difference of 0.74%), and Spanish American Indian (82.9%, a difference of 0.80%).
| Demographics | Rating | Rank | 12th Grade, No Diploma |
| Immigrants | Latin America | 0.0 /100 | #333 | Tragic 85.0% |
| Immigrants | Dominican Republic | 0.0 /100 | #334 | Tragic 84.9% |
| Immigrants | Yemen | 0.0 /100 | #335 | Tragic 84.8% |
| Tohono O'odham | 0.0 /100 | #336 | Tragic 84.7% |
| Pima | 0.0 /100 | #337 | Tragic 84.6% |
| Guatemalans | 0.0 /100 | #338 | Tragic 84.6% |
| Salvadorans | 0.0 /100 | #339 | Tragic 84.5% |
| Mexicans | 0.0 /100 | #340 | Tragic 84.1% |
| Immigrants | Guatemala | 0.0 /100 | #341 | Tragic 84.0% |
| Houma | 0.0 /100 | #342 | Tragic 83.7% |
| Immigrants | El Salvador | 0.0 /100 | #343 | Tragic 83.6% |
| Immigrants | Central America | 0.0 /100 | #344 | Tragic 83.0% |
| Spanish American Indians | 0.0 /100 | #345 | Tragic 82.9% |
| Yakama | 0.0 /100 | #346 | Tragic 82.5% |
| Immigrants | Mexico | 0.0 /100 | #347 | Tragic 82.4% |