Immigrants from Southern Europe vs Immigrants from El Salvador 12th Grade, No Diploma
COMPARE
Immigrants from Southern Europe
Immigrants from El Salvador
12th Grade, No Diploma
12th Grade, No Diploma Comparison
Immigrants from Southern Europe
Immigrants from El Salvador
90.8%
12TH GRADE, NO DIPLOMA
19.9/ 100
METRIC RATING
199th/ 347
METRIC RANK
83.6%
12TH GRADE, NO DIPLOMA
0.0/ 100
METRIC RATING
343rd/ 347
METRIC RANK
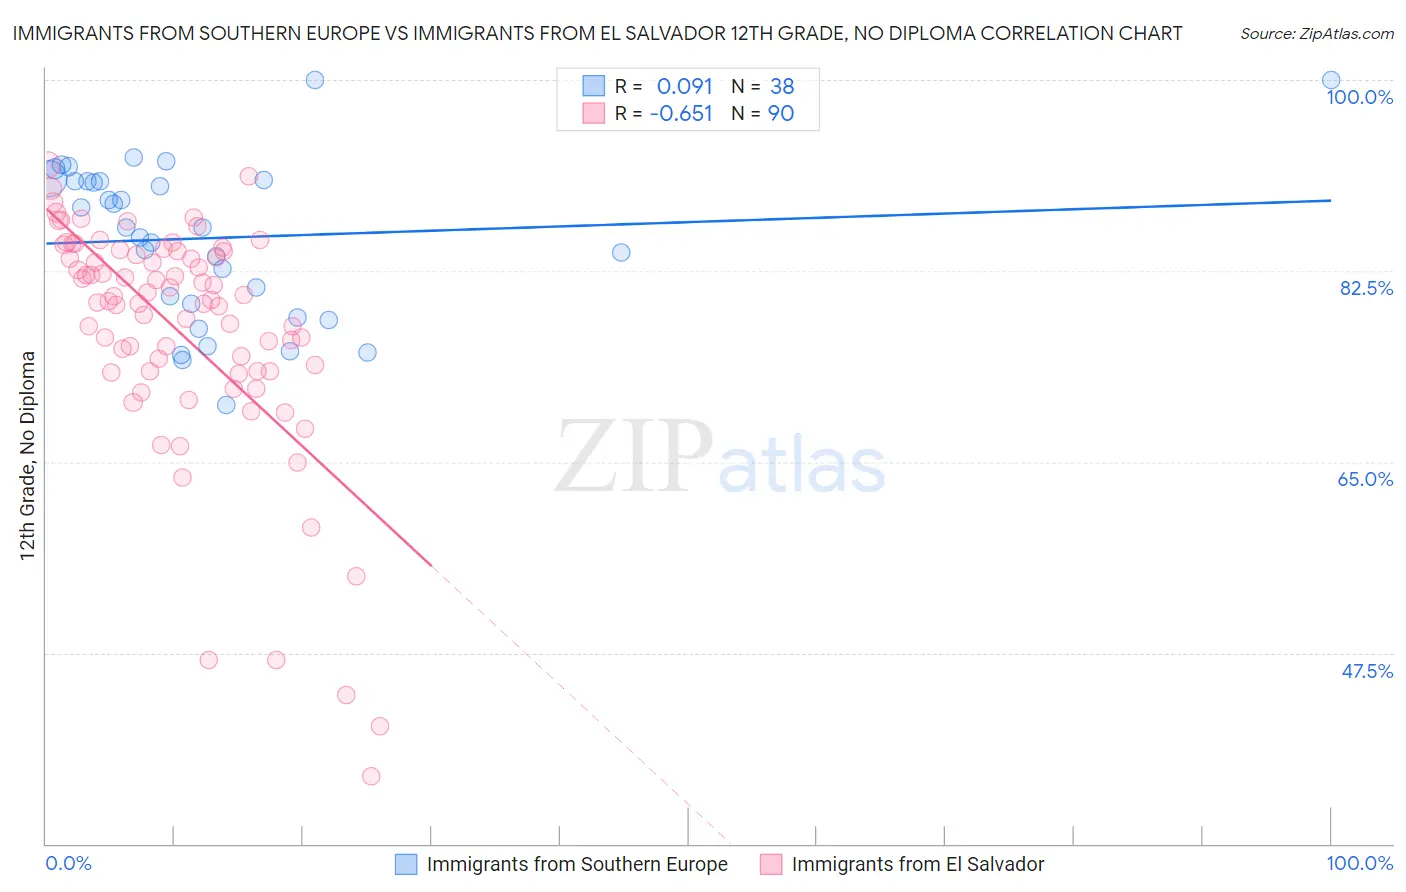
Immigrants from Southern Europe vs Immigrants from El Salvador 12th Grade, No Diploma Correlation Chart
The statistical analysis conducted on geographies consisting of 402,804,595 people shows a slight positive correlation between the proportion of Immigrants from Southern Europe and percentage of population with at least 12th grade (no diploma) education in the United States with a correlation coefficient (R) of 0.091 and weighted average of 90.8%. Similarly, the statistical analysis conducted on geographies consisting of 357,852,938 people shows a significant negative correlation between the proportion of Immigrants from El Salvador and percentage of population with at least 12th grade (no diploma) education in the United States with a correlation coefficient (R) of -0.651 and weighted average of 83.6%, a difference of 8.6%.
12th Grade, No Diploma Correlation Summary
| Measurement | Immigrants from Southern Europe | Immigrants from El Salvador |
| Minimum | 70.2% | 36.2% |
| Maximum | 100.0% | 92.2% |
| Range | 29.8% | 56.0% |
| Mean | 85.5% | 77.1% |
| Median | 86.5% | 79.8% |
| Interquartile 25% (IQ1) | 79.5% | 73.3% |
| Interquartile 75% (IQ3) | 90.8% | 84.3% |
| Interquartile Range (IQR) | 11.3% | 11.0% |
| Standard Deviation (Sample) | 7.3% | 10.9% |
| Standard Deviation (Population) | 7.2% | 10.9% |
Similar Demographics by 12th Grade, No Diploma
Demographics Similar to Immigrants from Southern Europe by 12th Grade, No Diploma
In terms of 12th grade, no diploma, the demographic groups most similar to Immigrants from Southern Europe are Liberian (90.8%, a difference of 0.0%), Hawaiian (90.8%, a difference of 0.0%), Samoan (90.8%, a difference of 0.010%), Marshallese (90.7%, a difference of 0.030%), and Panamanian (90.8%, a difference of 0.050%).
| Demographics | Rating | Rank | 12th Grade, No Diploma |
| Immigrants | Eastern Africa | 27.7 /100 | #192 | Fair 90.9% |
| Immigrants | Ethiopia | 27.2 /100 | #193 | Fair 90.9% |
| Immigrants | Oceania | 26.0 /100 | #194 | Fair 90.9% |
| Koreans | 24.5 /100 | #195 | Fair 90.8% |
| Panamanians | 22.8 /100 | #196 | Fair 90.8% |
| Immigrants | Sudan | 22.6 /100 | #197 | Fair 90.8% |
| Samoans | 20.4 /100 | #198 | Fair 90.8% |
| Immigrants | Southern Europe | 19.9 /100 | #199 | Poor 90.8% |
| Liberians | 19.8 /100 | #200 | Poor 90.8% |
| Hawaiians | 19.7 /100 | #201 | Poor 90.8% |
| Marshallese | 18.2 /100 | #202 | Poor 90.7% |
| Tongans | 16.1 /100 | #203 | Poor 90.7% |
| French American Indians | 15.5 /100 | #204 | Poor 90.7% |
| Immigrants | Sierra Leone | 14.9 /100 | #205 | Poor 90.7% |
| Immigrants | Bolivia | 12.3 /100 | #206 | Poor 90.6% |
Demographics Similar to Immigrants from El Salvador by 12th Grade, No Diploma
In terms of 12th grade, no diploma, the demographic groups most similar to Immigrants from El Salvador are Houma (83.7%, a difference of 0.16%), Immigrants from Guatemala (84.0%, a difference of 0.51%), Mexican (84.1%, a difference of 0.65%), Immigrants from Central America (83.0%, a difference of 0.74%), and Spanish American Indian (82.9%, a difference of 0.80%).
| Demographics | Rating | Rank | 12th Grade, No Diploma |
| Immigrants | Latin America | 0.0 /100 | #333 | Tragic 85.0% |
| Immigrants | Dominican Republic | 0.0 /100 | #334 | Tragic 84.9% |
| Immigrants | Yemen | 0.0 /100 | #335 | Tragic 84.8% |
| Tohono O'odham | 0.0 /100 | #336 | Tragic 84.7% |
| Pima | 0.0 /100 | #337 | Tragic 84.6% |
| Guatemalans | 0.0 /100 | #338 | Tragic 84.6% |
| Salvadorans | 0.0 /100 | #339 | Tragic 84.5% |
| Mexicans | 0.0 /100 | #340 | Tragic 84.1% |
| Immigrants | Guatemala | 0.0 /100 | #341 | Tragic 84.0% |
| Houma | 0.0 /100 | #342 | Tragic 83.7% |
| Immigrants | El Salvador | 0.0 /100 | #343 | Tragic 83.6% |
| Immigrants | Central America | 0.0 /100 | #344 | Tragic 83.0% |
| Spanish American Indians | 0.0 /100 | #345 | Tragic 82.9% |
| Yakama | 0.0 /100 | #346 | Tragic 82.5% |
| Immigrants | Mexico | 0.0 /100 | #347 | Tragic 82.4% |