Immigrants from Bahamas vs Immigrants from El Salvador 12th Grade, No Diploma
COMPARE
Immigrants from Bahamas
Immigrants from El Salvador
12th Grade, No Diploma
12th Grade, No Diploma Comparison
Immigrants from Bahamas
Immigrants from El Salvador
90.2%
12TH GRADE, NO DIPLOMA
3.6/ 100
METRIC RATING
229th/ 347
METRIC RANK
83.6%
12TH GRADE, NO DIPLOMA
0.0/ 100
METRIC RATING
343rd/ 347
METRIC RANK
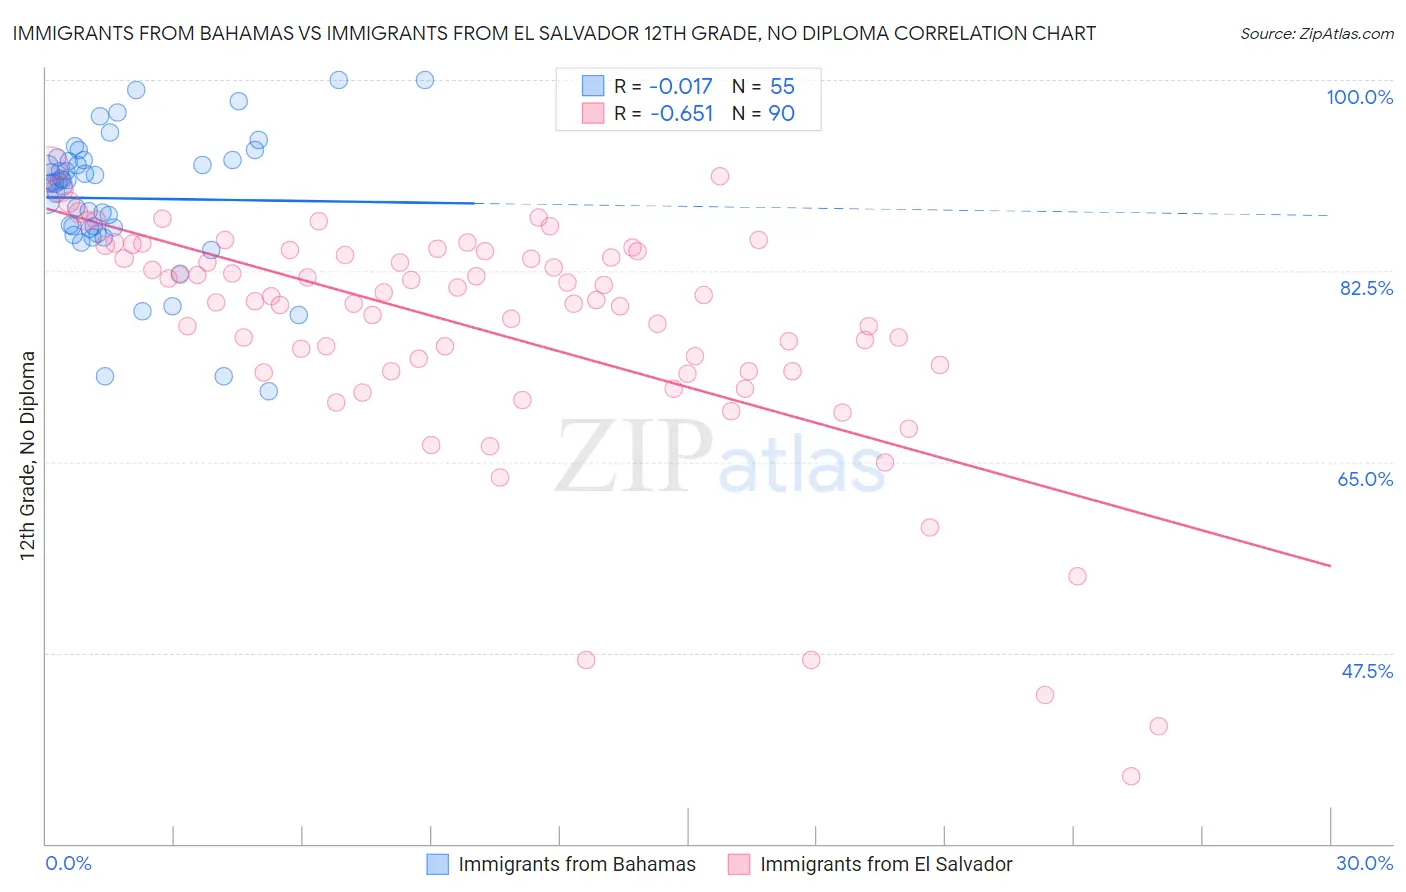
Immigrants from Bahamas vs Immigrants from El Salvador 12th Grade, No Diploma Correlation Chart
The statistical analysis conducted on geographies consisting of 104,668,341 people shows no correlation between the proportion of Immigrants from Bahamas and percentage of population with at least 12th grade (no diploma) education in the United States with a correlation coefficient (R) of -0.017 and weighted average of 90.2%. Similarly, the statistical analysis conducted on geographies consisting of 357,852,938 people shows a significant negative correlation between the proportion of Immigrants from El Salvador and percentage of population with at least 12th grade (no diploma) education in the United States with a correlation coefficient (R) of -0.651 and weighted average of 83.6%, a difference of 8.0%.
12th Grade, No Diploma Correlation Summary
| Measurement | Immigrants from Bahamas | Immigrants from El Salvador |
| Minimum | 71.4% | 36.2% |
| Maximum | 100.0% | 92.2% |
| Range | 28.6% | 56.0% |
| Mean | 89.2% | 77.1% |
| Median | 90.7% | 79.8% |
| Interquartile 25% (IQ1) | 86.4% | 73.3% |
| Interquartile 75% (IQ3) | 92.7% | 84.3% |
| Interquartile Range (IQR) | 6.3% | 11.0% |
| Standard Deviation (Sample) | 6.3% | 10.9% |
| Standard Deviation (Population) | 6.2% | 10.9% |
Similar Demographics by 12th Grade, No Diploma
Demographics Similar to Immigrants from Bahamas by 12th Grade, No Diploma
In terms of 12th grade, no diploma, the demographic groups most similar to Immigrants from Bahamas are Creek (90.3%, a difference of 0.020%), Nigerian (90.3%, a difference of 0.070%), Immigrants from Zaire (90.3%, a difference of 0.080%), Immigrants from Panama (90.3%, a difference of 0.090%), and Chickasaw (90.3%, a difference of 0.090%).
| Demographics | Rating | Rank | 12th Grade, No Diploma |
| Immigrants | Somalia | 5.3 /100 | #222 | Tragic 90.4% |
| South Americans | 5.0 /100 | #223 | Tragic 90.3% |
| Immigrants | Panama | 4.8 /100 | #224 | Tragic 90.3% |
| Chickasaw | 4.8 /100 | #225 | Tragic 90.3% |
| Immigrants | Zaire | 4.6 /100 | #226 | Tragic 90.3% |
| Nigerians | 4.5 /100 | #227 | Tragic 90.3% |
| Creek | 3.9 /100 | #228 | Tragic 90.3% |
| Immigrants | Bahamas | 3.6 /100 | #229 | Tragic 90.2% |
| Immigrants | Philippines | 2.8 /100 | #230 | Tragic 90.2% |
| Peruvians | 2.7 /100 | #231 | Tragic 90.2% |
| Blackfeet | 2.4 /100 | #232 | Tragic 90.1% |
| Immigrants | Thailand | 2.3 /100 | #233 | Tragic 90.1% |
| Immigrants | South America | 2.3 /100 | #234 | Tragic 90.1% |
| Colville | 2.3 /100 | #235 | Tragic 90.1% |
| Immigrants | Uzbekistan | 2.2 /100 | #236 | Tragic 90.1% |
Demographics Similar to Immigrants from El Salvador by 12th Grade, No Diploma
In terms of 12th grade, no diploma, the demographic groups most similar to Immigrants from El Salvador are Houma (83.7%, a difference of 0.16%), Immigrants from Guatemala (84.0%, a difference of 0.51%), Mexican (84.1%, a difference of 0.65%), Immigrants from Central America (83.0%, a difference of 0.74%), and Spanish American Indian (82.9%, a difference of 0.80%).
| Demographics | Rating | Rank | 12th Grade, No Diploma |
| Immigrants | Latin America | 0.0 /100 | #333 | Tragic 85.0% |
| Immigrants | Dominican Republic | 0.0 /100 | #334 | Tragic 84.9% |
| Immigrants | Yemen | 0.0 /100 | #335 | Tragic 84.8% |
| Tohono O'odham | 0.0 /100 | #336 | Tragic 84.7% |
| Pima | 0.0 /100 | #337 | Tragic 84.6% |
| Guatemalans | 0.0 /100 | #338 | Tragic 84.6% |
| Salvadorans | 0.0 /100 | #339 | Tragic 84.5% |
| Mexicans | 0.0 /100 | #340 | Tragic 84.1% |
| Immigrants | Guatemala | 0.0 /100 | #341 | Tragic 84.0% |
| Houma | 0.0 /100 | #342 | Tragic 83.7% |
| Immigrants | El Salvador | 0.0 /100 | #343 | Tragic 83.6% |
| Immigrants | Central America | 0.0 /100 | #344 | Tragic 83.0% |
| Spanish American Indians | 0.0 /100 | #345 | Tragic 82.9% |
| Yakama | 0.0 /100 | #346 | Tragic 82.5% |
| Immigrants | Mexico | 0.0 /100 | #347 | Tragic 82.4% |