Spaniard vs Filipino 12th Grade, No Diploma
COMPARE
Spaniard
Filipino
12th Grade, No Diploma
12th Grade, No Diploma Comparison
Spaniards
Filipinos
91.0%
12TH GRADE, NO DIPLOMA
36.2/ 100
METRIC RATING
184th/ 347
METRIC RANK
93.2%
12TH GRADE, NO DIPLOMA
99.9/ 100
METRIC RATING
20th/ 347
METRIC RANK
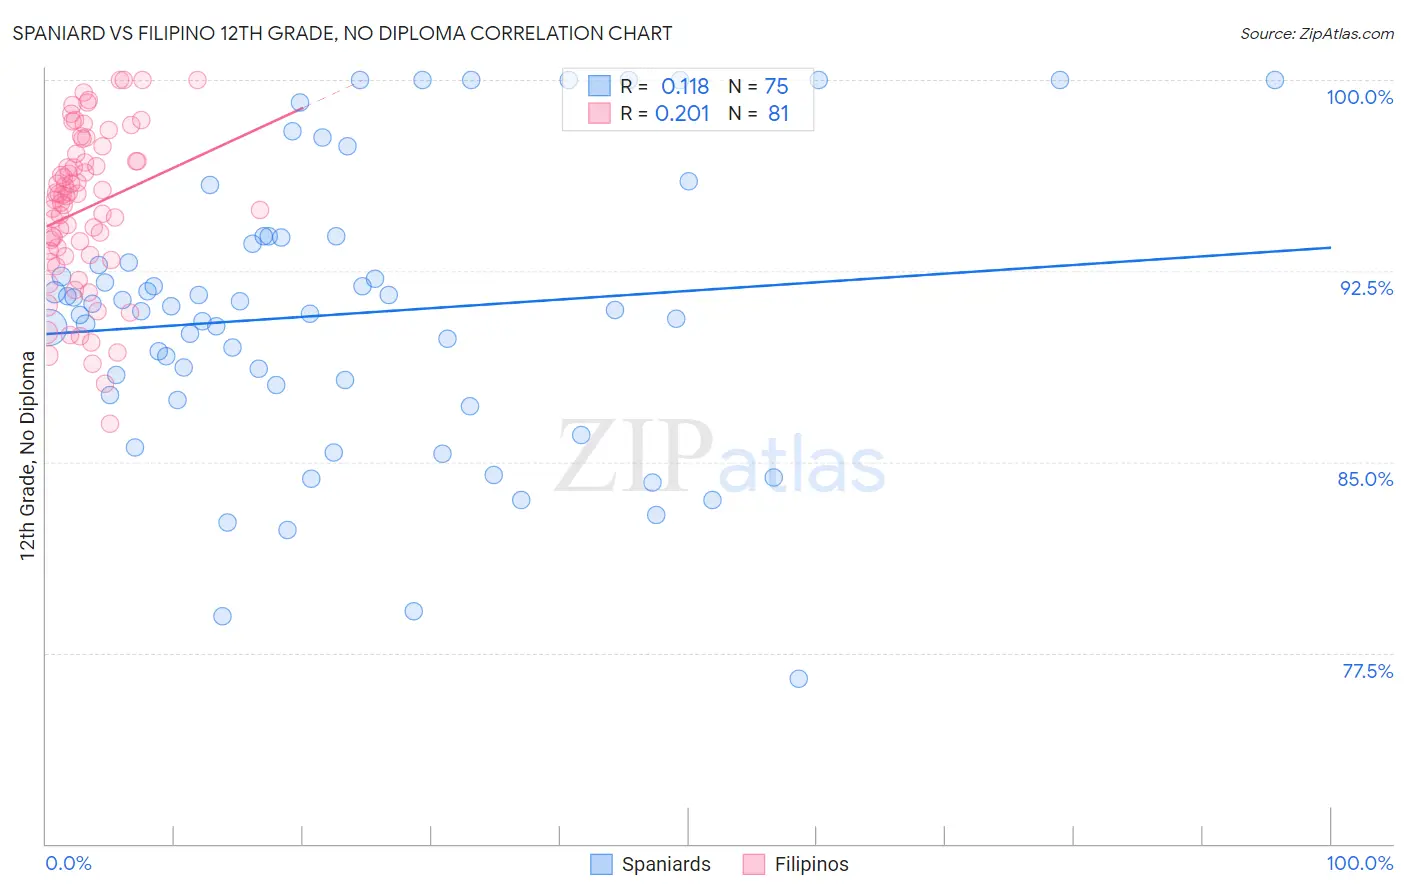
Spaniard vs Filipino 12th Grade, No Diploma Correlation Chart
The statistical analysis conducted on geographies consisting of 443,544,054 people shows a poor positive correlation between the proportion of Spaniards and percentage of population with at least 12th grade (no diploma) education in the United States with a correlation coefficient (R) of 0.118 and weighted average of 91.0%. Similarly, the statistical analysis conducted on geographies consisting of 254,351,912 people shows a weak positive correlation between the proportion of Filipinos and percentage of population with at least 12th grade (no diploma) education in the United States with a correlation coefficient (R) of 0.201 and weighted average of 93.2%, a difference of 2.4%.
12th Grade, No Diploma Correlation Summary
| Measurement | Spaniard | Filipino |
| Minimum | 76.5% | 86.5% |
| Maximum | 100.0% | 100.0% |
| Range | 23.5% | 13.5% |
| Mean | 90.8% | 94.9% |
| Median | 91.0% | 95.4% |
| Interquartile 25% (IQ1) | 87.6% | 93.1% |
| Interquartile 75% (IQ3) | 93.8% | 97.0% |
| Interquartile Range (IQR) | 6.2% | 3.9% |
| Standard Deviation (Sample) | 5.5% | 3.1% |
| Standard Deviation (Population) | 5.5% | 3.1% |
Similar Demographics by 12th Grade, No Diploma
Demographics Similar to Spaniards by 12th Grade, No Diploma
In terms of 12th grade, no diploma, the demographic groups most similar to Spaniards are Sudanese (91.0%, a difference of 0.020%), Nonimmigrants (91.0%, a difference of 0.030%), Osage (91.0%, a difference of 0.030%), Ethiopian (91.0%, a difference of 0.030%), and Guamanian/Chamorro (91.0%, a difference of 0.040%).
| Demographics | Rating | Rank | 12th Grade, No Diploma |
| Sierra Leoneans | 47.7 /100 | #177 | Average 91.1% |
| Spanish | 43.7 /100 | #178 | Average 91.1% |
| Immigrants | Chile | 43.3 /100 | #179 | Average 91.1% |
| Immigrants | Syria | 40.3 /100 | #180 | Average 91.1% |
| Guamanians/Chamorros | 39.5 /100 | #181 | Fair 91.0% |
| Immigrants | Nonimmigrants | 38.8 /100 | #182 | Fair 91.0% |
| Osage | 38.3 /100 | #183 | Fair 91.0% |
| Spaniards | 36.2 /100 | #184 | Fair 91.0% |
| Sudanese | 34.4 /100 | #185 | Fair 91.0% |
| Ethiopians | 33.9 /100 | #186 | Fair 91.0% |
| Potawatomi | 32.9 /100 | #187 | Fair 91.0% |
| Americans | 32.6 /100 | #188 | Fair 91.0% |
| Immigrants | Uganda | 31.6 /100 | #189 | Fair 90.9% |
| Afghans | 29.9 /100 | #190 | Fair 90.9% |
| Moroccans | 28.8 /100 | #191 | Fair 90.9% |
Demographics Similar to Filipinos by 12th Grade, No Diploma
In terms of 12th grade, no diploma, the demographic groups most similar to Filipinos are Italian (93.2%, a difference of 0.020%), German (93.3%, a difference of 0.030%), Estonian (93.2%, a difference of 0.030%), Scandinavian (93.2%, a difference of 0.040%), and Immigrants from Singapore (93.3%, a difference of 0.050%).
| Demographics | Rating | Rank | 12th Grade, No Diploma |
| Danes | 100.0 /100 | #13 | Exceptional 93.5% |
| Bulgarians | 100.0 /100 | #14 | Exceptional 93.5% |
| Finns | 100.0 /100 | #15 | Exceptional 93.4% |
| Maltese | 100.0 /100 | #16 | Exceptional 93.3% |
| Luxembourgers | 100.0 /100 | #17 | Exceptional 93.3% |
| Immigrants | Singapore | 99.9 /100 | #18 | Exceptional 93.3% |
| Germans | 99.9 /100 | #19 | Exceptional 93.3% |
| Filipinos | 99.9 /100 | #20 | Exceptional 93.2% |
| Italians | 99.9 /100 | #21 | Exceptional 93.2% |
| Estonians | 99.9 /100 | #22 | Exceptional 93.2% |
| Scandinavians | 99.9 /100 | #23 | Exceptional 93.2% |
| Thais | 99.9 /100 | #24 | Exceptional 93.2% |
| Czechs | 99.9 /100 | #25 | Exceptional 93.2% |
| Russians | 99.9 /100 | #26 | Exceptional 93.2% |
| Cypriots | 99.9 /100 | #27 | Exceptional 93.1% |