Spaniard vs Nonimmigrants 12th Grade, No Diploma
COMPARE
Spaniard
Nonimmigrants
12th Grade, No Diploma
12th Grade, No Diploma Comparison
Spaniards
Nonimmigrants
91.0%
12TH GRADE, NO DIPLOMA
36.2/ 100
METRIC RATING
184th/ 347
METRIC RANK
91.0%
12TH GRADE, NO DIPLOMA
38.8/ 100
METRIC RATING
182nd/ 347
METRIC RANK
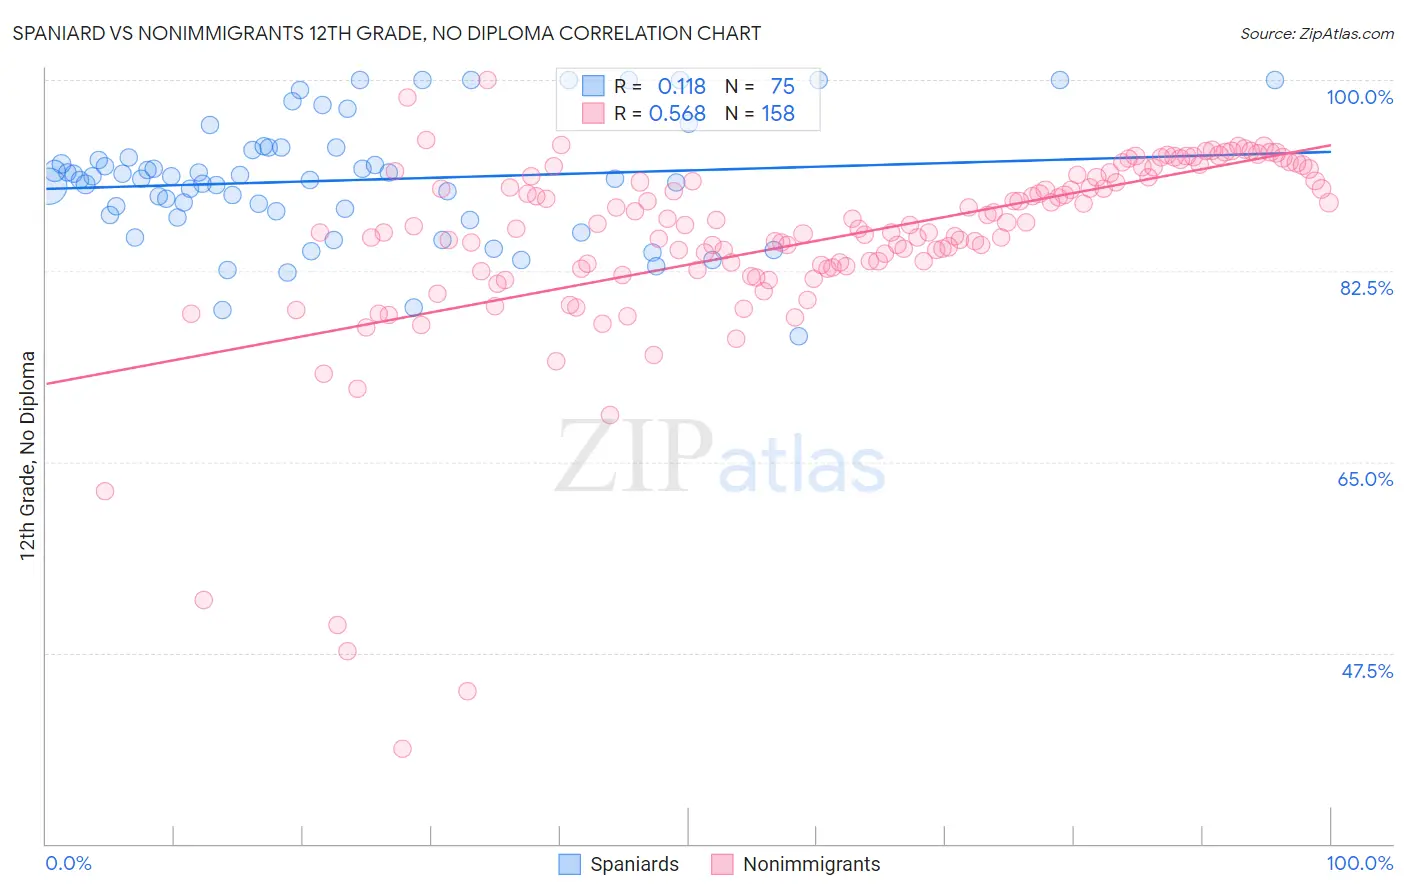
Spaniard vs Nonimmigrants 12th Grade, No Diploma Correlation Chart
The statistical analysis conducted on geographies consisting of 443,544,054 people shows a poor positive correlation between the proportion of Spaniards and percentage of population with at least 12th grade (no diploma) education in the United States with a correlation coefficient (R) of 0.118 and weighted average of 91.0%. Similarly, the statistical analysis conducted on geographies consisting of 585,370,179 people shows a substantial positive correlation between the proportion of Nonimmigrants and percentage of population with at least 12th grade (no diploma) education in the United States with a correlation coefficient (R) of 0.568 and weighted average of 91.0%, a difference of 0.030%.
12th Grade, No Diploma Correlation Summary
| Measurement | Spaniard | Nonimmigrants |
| Minimum | 76.5% | 38.7% |
| Maximum | 100.0% | 100.0% |
| Range | 23.5% | 61.3% |
| Mean | 90.8% | 85.3% |
| Median | 91.0% | 86.5% |
| Interquartile 25% (IQ1) | 87.6% | 82.8% |
| Interquartile 75% (IQ3) | 93.8% | 91.1% |
| Interquartile Range (IQR) | 6.2% | 8.3% |
| Standard Deviation (Sample) | 5.5% | 9.1% |
| Standard Deviation (Population) | 5.5% | 9.1% |
Demographics Similar to Spaniards and Nonimmigrants by 12th Grade, No Diploma
In terms of 12th grade, no diploma, the demographic groups most similar to Spaniards are Sudanese (91.0%, a difference of 0.020%), Osage (91.0%, a difference of 0.030%), Ethiopian (91.0%, a difference of 0.030%), Guamanian/Chamorro (91.0%, a difference of 0.040%), and Immigrants from Syria (91.1%, a difference of 0.050%). Similarly, the demographic groups most similar to Nonimmigrants are Guamanian/Chamorro (91.0%, a difference of 0.010%), Osage (91.0%, a difference of 0.010%), Immigrants from Syria (91.1%, a difference of 0.020%), Spanish (91.1%, a difference of 0.060%), and Immigrants from Chile (91.1%, a difference of 0.060%).
| Demographics | Rating | Rank | 12th Grade, No Diploma |
| Bolivians | 50.4 /100 | #173 | Average 91.2% |
| Immigrants | Nepal | 50.0 /100 | #174 | Average 91.2% |
| Immigrants | Western Asia | 49.0 /100 | #175 | Average 91.2% |
| Iroquois | 48.5 /100 | #176 | Average 91.1% |
| Sierra Leoneans | 47.7 /100 | #177 | Average 91.1% |
| Spanish | 43.7 /100 | #178 | Average 91.1% |
| Immigrants | Chile | 43.3 /100 | #179 | Average 91.1% |
| Immigrants | Syria | 40.3 /100 | #180 | Average 91.1% |
| Guamanians/Chamorros | 39.5 /100 | #181 | Fair 91.0% |
| Immigrants | Nonimmigrants | 38.8 /100 | #182 | Fair 91.0% |
| Osage | 38.3 /100 | #183 | Fair 91.0% |
| Spaniards | 36.2 /100 | #184 | Fair 91.0% |
| Sudanese | 34.4 /100 | #185 | Fair 91.0% |
| Ethiopians | 33.9 /100 | #186 | Fair 91.0% |
| Potawatomi | 32.9 /100 | #187 | Fair 91.0% |
| Americans | 32.6 /100 | #188 | Fair 91.0% |
| Immigrants | Uganda | 31.6 /100 | #189 | Fair 90.9% |
| Afghans | 29.9 /100 | #190 | Fair 90.9% |
| Moroccans | 28.8 /100 | #191 | Fair 90.9% |
| Immigrants | Eastern Africa | 27.7 /100 | #192 | Fair 90.9% |
| Immigrants | Ethiopia | 27.2 /100 | #193 | Fair 90.9% |