Swedish vs Immigrants from Congo 8th Grade
COMPARE
Swedish
Immigrants from Congo
8th Grade
8th Grade Comparison
Swedes
Immigrants from Congo
97.4%
8TH GRADE
100.0/ 100
METRIC RATING
12th/ 347
METRIC RANK
94.9%
8TH GRADE
0.6/ 100
METRIC RATING
258th/ 347
METRIC RANK
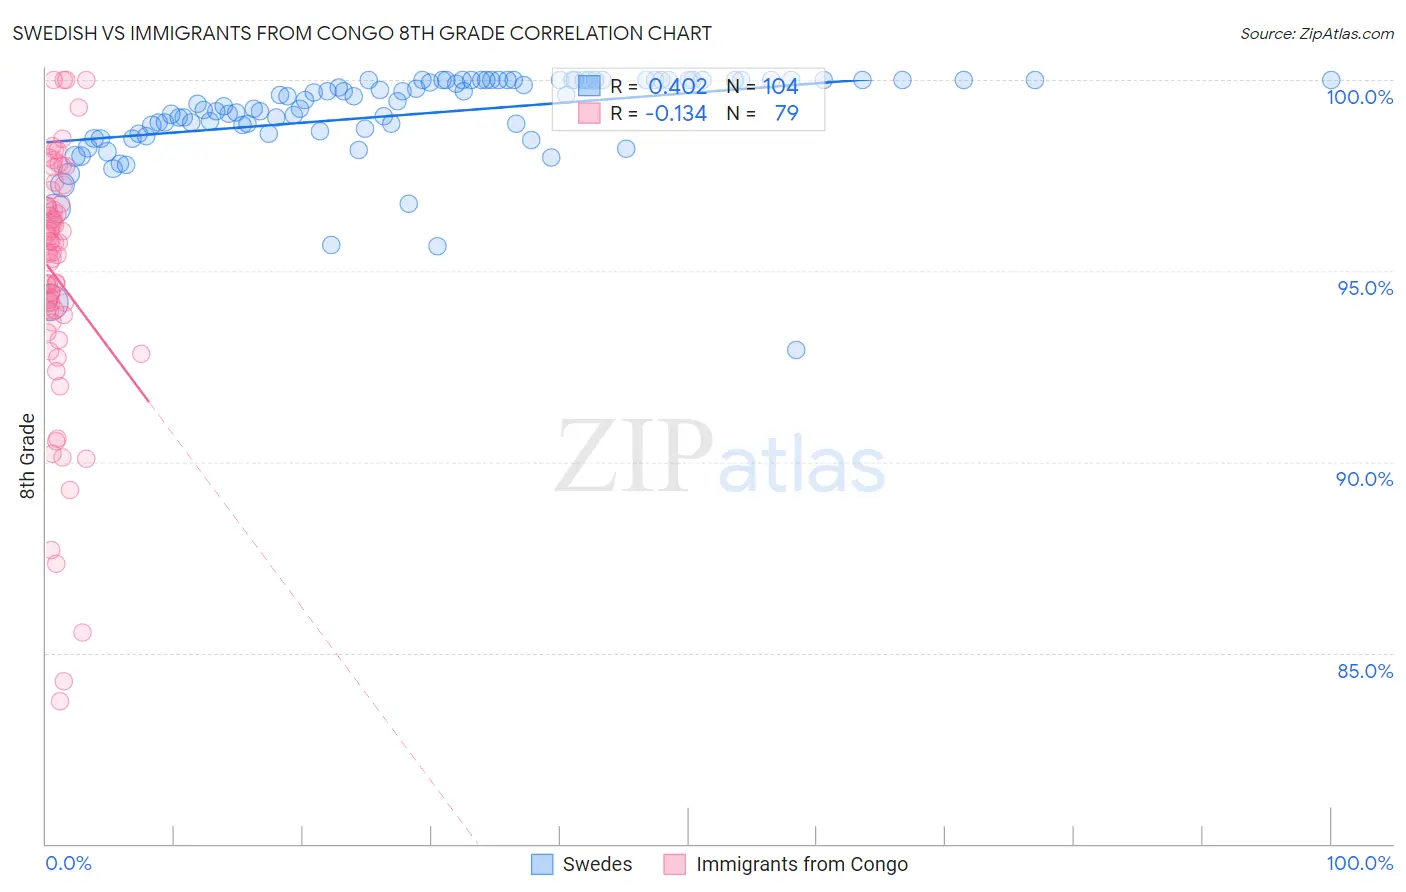
Swedish vs Immigrants from Congo 8th Grade Correlation Chart
The statistical analysis conducted on geographies consisting of 539,231,492 people shows a moderate positive correlation between the proportion of Swedes and percentage of population with at least 8th grade education in the United States with a correlation coefficient (R) of 0.402 and weighted average of 97.4%. Similarly, the statistical analysis conducted on geographies consisting of 92,121,907 people shows a poor negative correlation between the proportion of Immigrants from Congo and percentage of population with at least 8th grade education in the United States with a correlation coefficient (R) of -0.134 and weighted average of 94.9%, a difference of 2.6%.
8th Grade Correlation Summary
| Measurement | Swedish | Immigrants from Congo |
| Minimum | 92.9% | 83.7% |
| Maximum | 100.0% | 100.0% |
| Range | 7.1% | 16.3% |
| Mean | 99.1% | 94.8% |
| Median | 99.5% | 95.5% |
| Interquartile 25% (IQ1) | 98.7% | 93.8% |
| Interquartile 75% (IQ3) | 100.0% | 96.7% |
| Interquartile Range (IQR) | 1.3% | 2.9% |
| Standard Deviation (Sample) | 1.2% | 3.4% |
| Standard Deviation (Population) | 1.2% | 3.4% |
Similar Demographics by 8th Grade
Demographics Similar to Swedes by 8th Grade
In terms of 8th grade, the demographic groups most similar to Swedes are Polish (97.4%, a difference of 0.030%), Slovene (97.5%, a difference of 0.060%), Alaskan Athabascan (97.3%, a difference of 0.070%), English (97.3%, a difference of 0.070%), and Pennsylvania German (97.3%, a difference of 0.080%).
| Demographics | Rating | Rank | 8th Grade |
| Ottawa | 100.0 /100 | #5 | Exceptional 97.9% |
| Dutch | 100.0 /100 | #6 | Exceptional 97.7% |
| Norwegians | 100.0 /100 | #7 | Exceptional 97.6% |
| Slovaks | 100.0 /100 | #8 | Exceptional 97.6% |
| Germans | 100.0 /100 | #9 | Exceptional 97.5% |
| Slovenes | 100.0 /100 | #10 | Exceptional 97.5% |
| Poles | 100.0 /100 | #11 | Exceptional 97.4% |
| Swedes | 100.0 /100 | #12 | Exceptional 97.4% |
| Alaskan Athabascans | 100.0 /100 | #13 | Exceptional 97.3% |
| English | 100.0 /100 | #14 | Exceptional 97.3% |
| Pennsylvania Germans | 100.0 /100 | #15 | Exceptional 97.3% |
| Tlingit-Haida | 100.0 /100 | #16 | Exceptional 97.3% |
| Irish | 100.0 /100 | #17 | Exceptional 97.3% |
| Lithuanians | 100.0 /100 | #18 | Exceptional 97.3% |
| Scottish | 100.0 /100 | #19 | Exceptional 97.3% |
Demographics Similar to Immigrants from Congo by 8th Grade
In terms of 8th grade, the demographic groups most similar to Immigrants from Congo are Ghanaian (94.9%, a difference of 0.0%), Afghan (94.9%, a difference of 0.010%), Immigrants from Jamaica (94.9%, a difference of 0.010%), Colombian (95.0%, a difference of 0.020%), and Immigrants from Somalia (95.0%, a difference of 0.030%).
| Demographics | Rating | Rank | 8th Grade |
| Bolivians | 1.0 /100 | #251 | Tragic 95.0% |
| Immigrants | Ethiopia | 1.0 /100 | #252 | Tragic 95.0% |
| U.S. Virgin Islanders | 0.9 /100 | #253 | Tragic 95.0% |
| Immigrants | Cameroon | 0.8 /100 | #254 | Tragic 95.0% |
| Immigrants | Somalia | 0.7 /100 | #255 | Tragic 95.0% |
| Colombians | 0.7 /100 | #256 | Tragic 95.0% |
| Afghans | 0.6 /100 | #257 | Tragic 94.9% |
| Immigrants | Congo | 0.6 /100 | #258 | Tragic 94.9% |
| Ghanaians | 0.6 /100 | #259 | Tragic 94.9% |
| Immigrants | Jamaica | 0.6 /100 | #260 | Tragic 94.9% |
| Immigrants | Costa Rica | 0.5 /100 | #261 | Tragic 94.9% |
| Immigrants | Nigeria | 0.4 /100 | #262 | Tragic 94.9% |
| Immigrants | Hong Kong | 0.4 /100 | #263 | Tragic 94.9% |
| South Americans | 0.4 /100 | #264 | Tragic 94.9% |
| Yuman | 0.4 /100 | #265 | Tragic 94.9% |